


Crypto Premarket Webinar 4th June 2025 + Charts

Premarket video:
BTCUSD weekly chart:- Bitcoin made a new all time high. This invalidated the double top target at 69-70k and could be the second high of a double top, though I’m not seeing much reason to think that might be the case. Weekly middle band support currently at 94073.

BTCUSD daily chart:- The daily RSI 5 sell signal has reached target. Daily middle band support currently at 106632 is broken.

BTCUSD 60min chart:- Bitcoin reached the high quality wedge resistance and broke over it slightly before breaking down. No obvious topping setup yet though watching possible H&S neckline area 101-3k. A possible bull flag megaphone is forming. A possible H&S is also forming though I’m very doubtful about this delivering a move to the 93.5k target area.

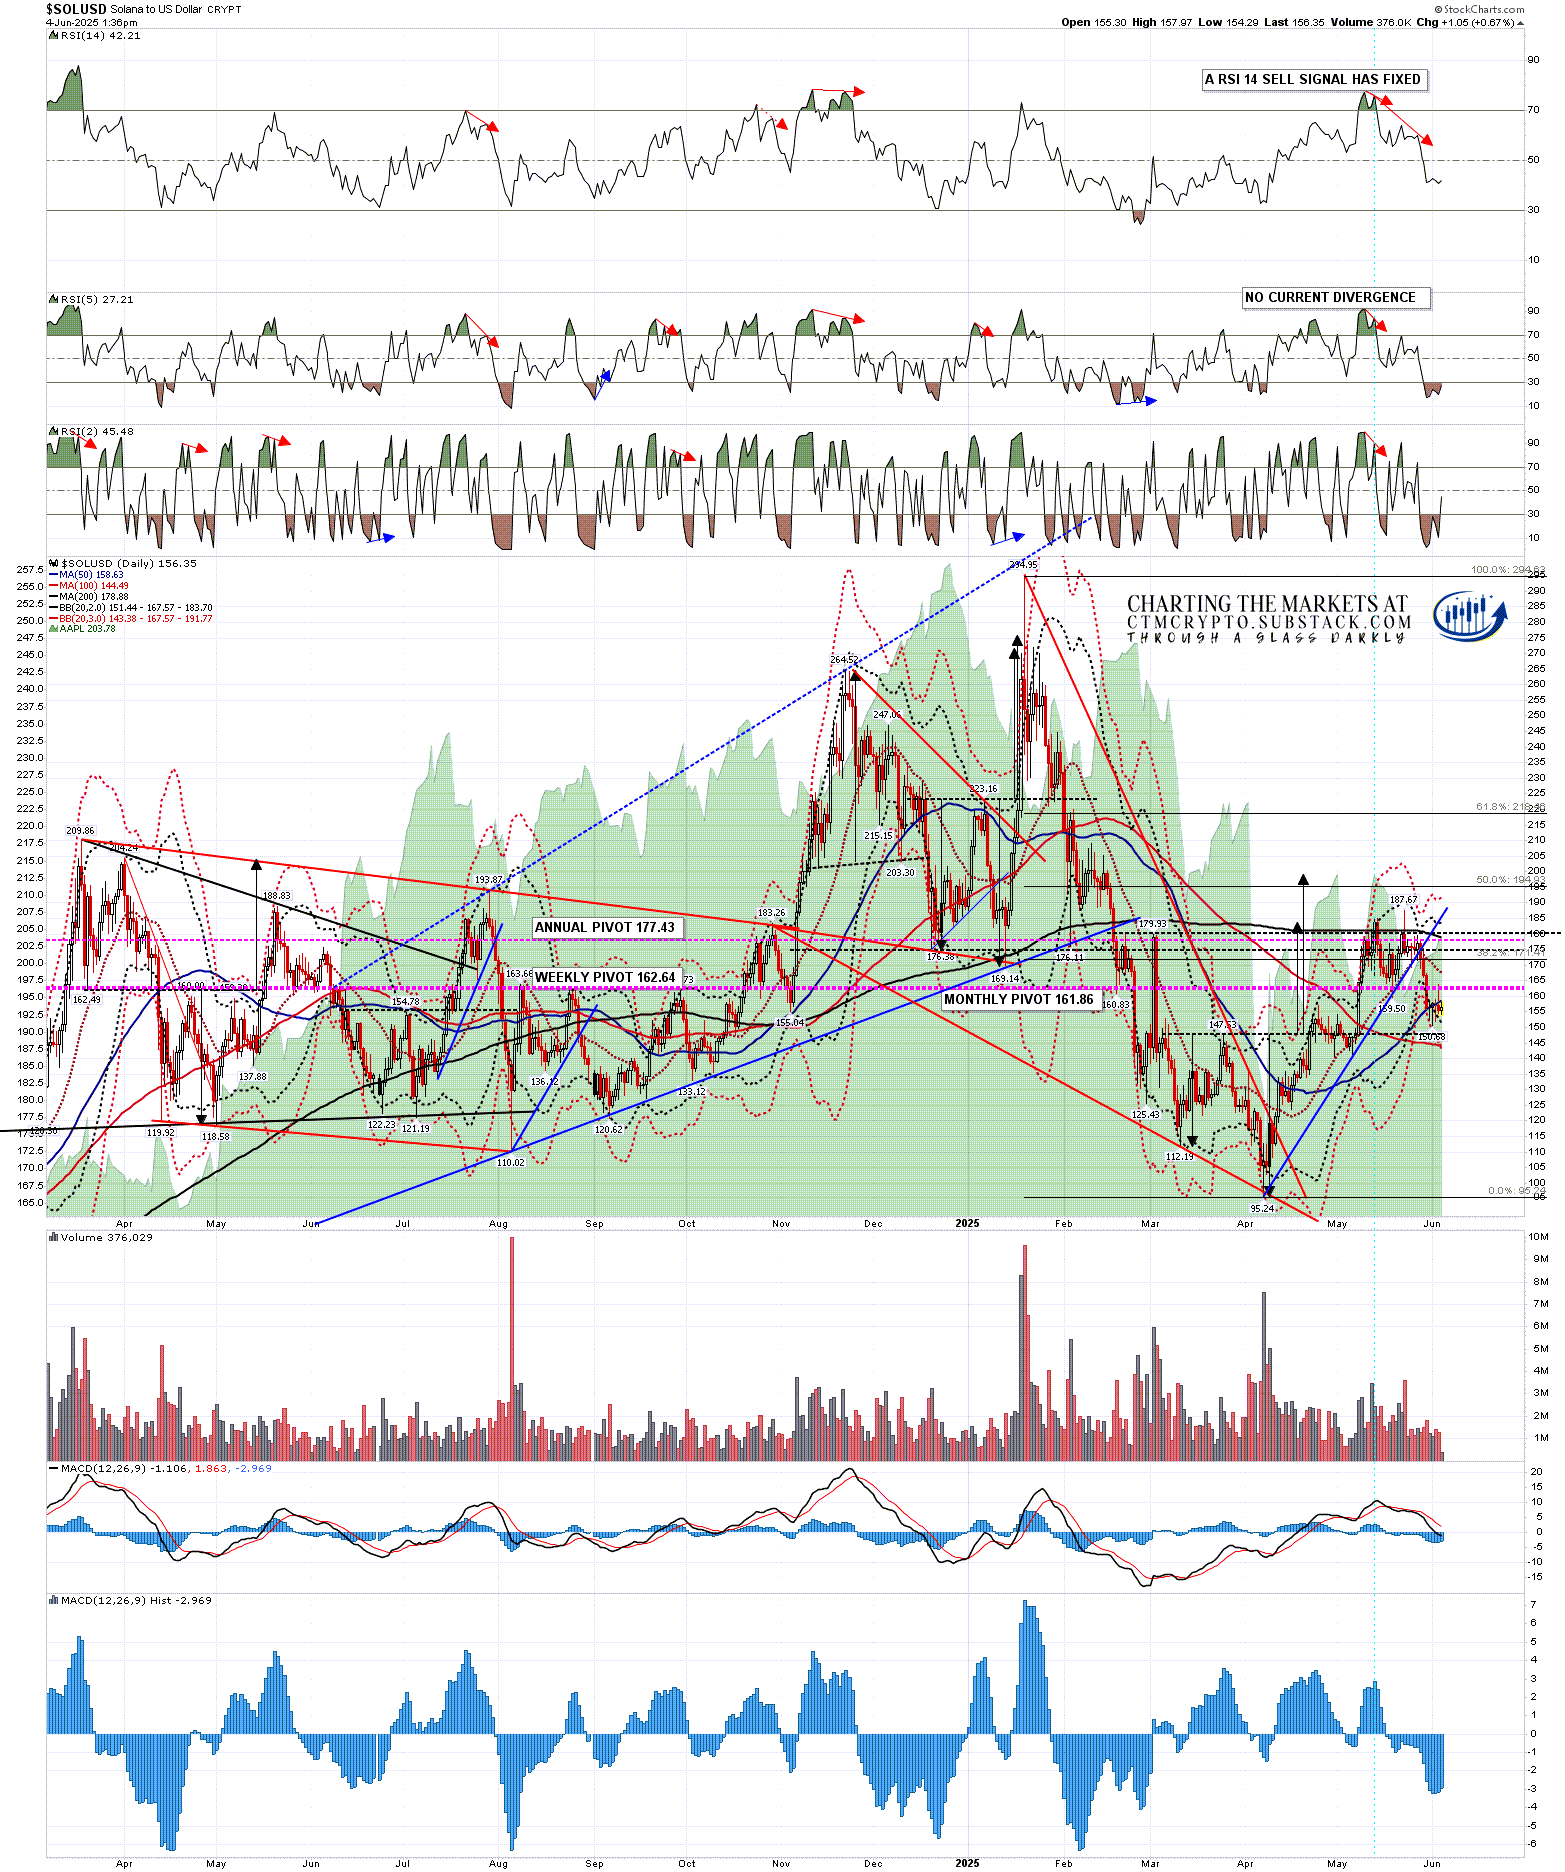
SOLUSD daily chart:- Weak RSI 14 & RSI 5 sell signals fixed. The weak daily RSI 5 sell signal has reached target. Testing & failing so far at the 200dma and testing the daily lower band.
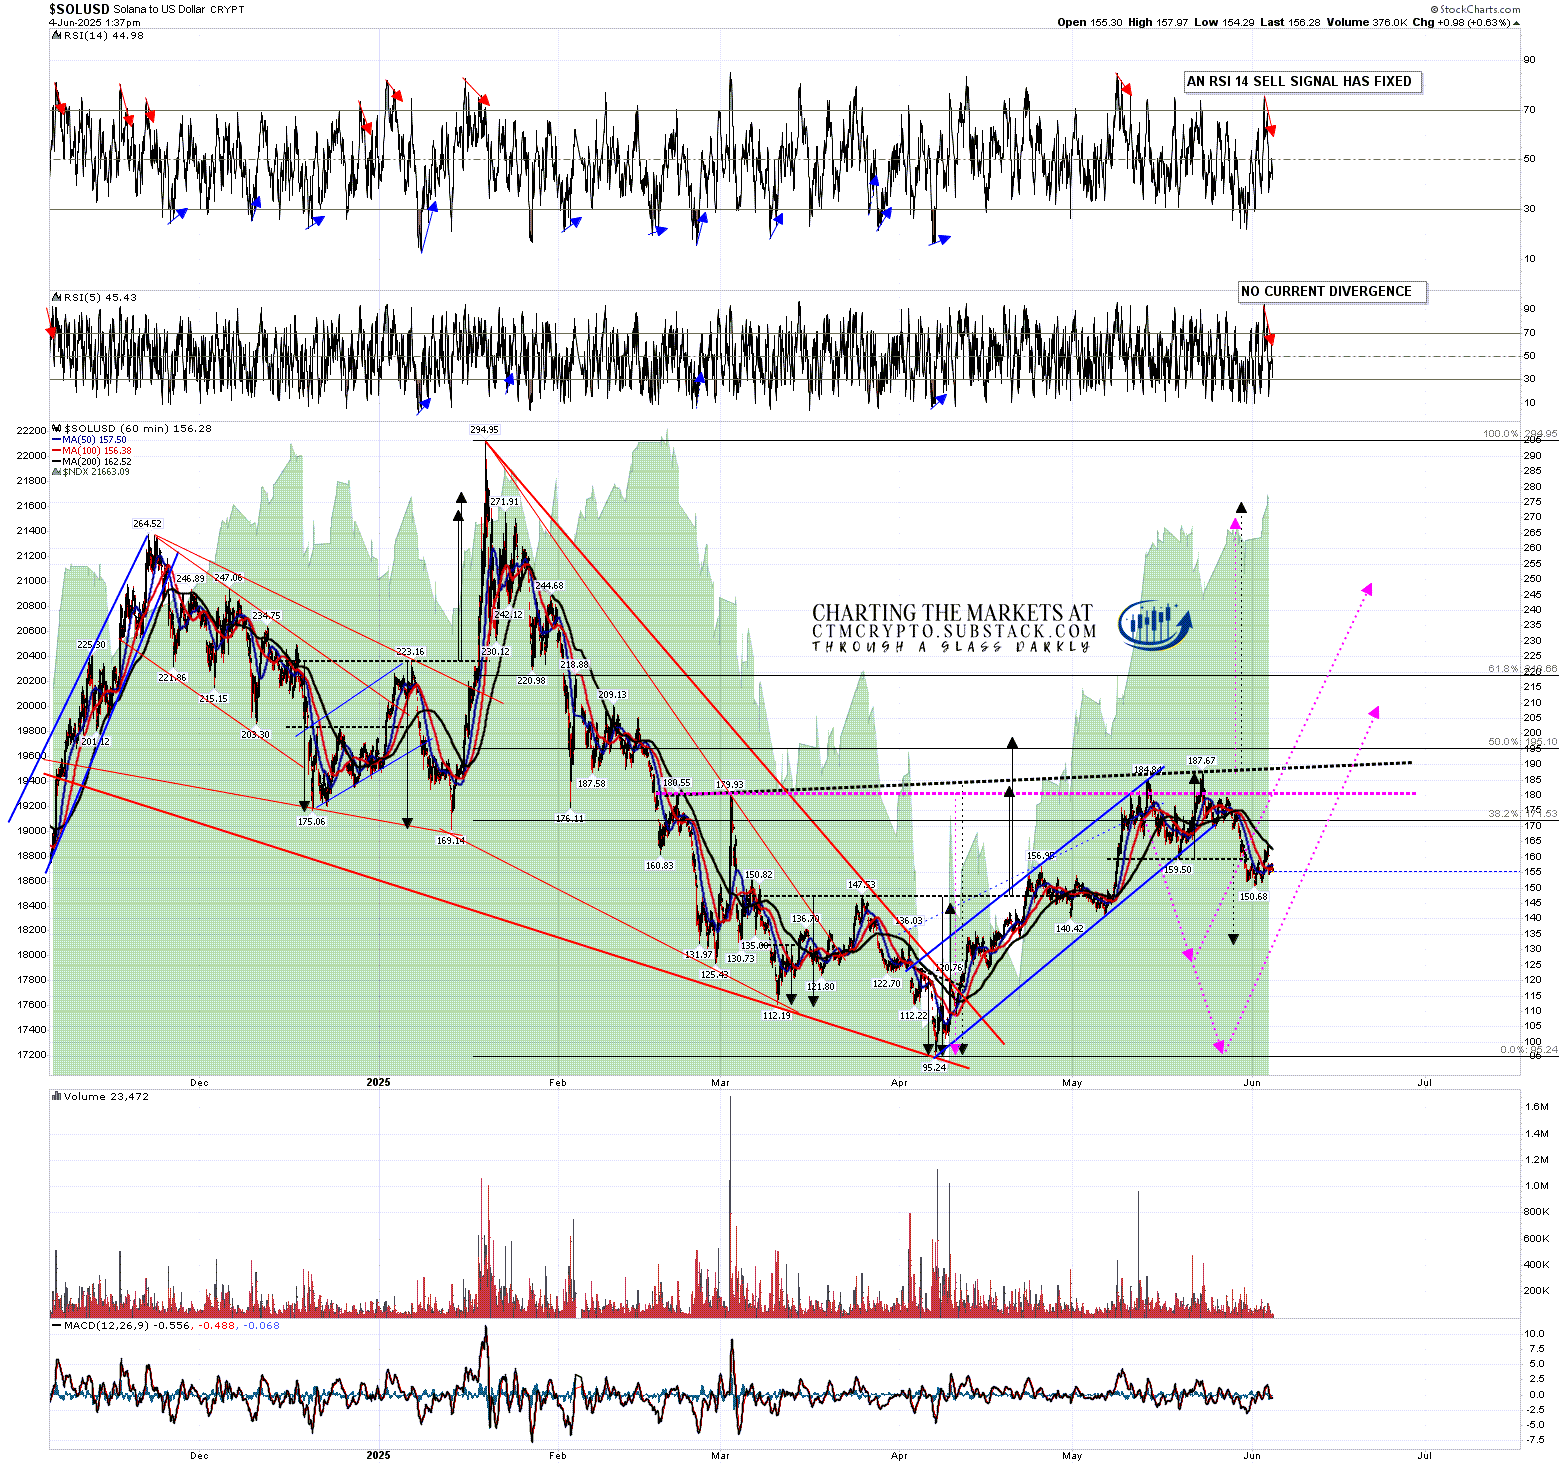
SOLUSD 60min chart:- High quality rising wedge formed which could be a bear flag & has broken down, retested the high in the second high of a double top, and is now breaking down with a target in the 131-4 area. Possible larger IHS forming. An RSI 14 sell signal has fixed.
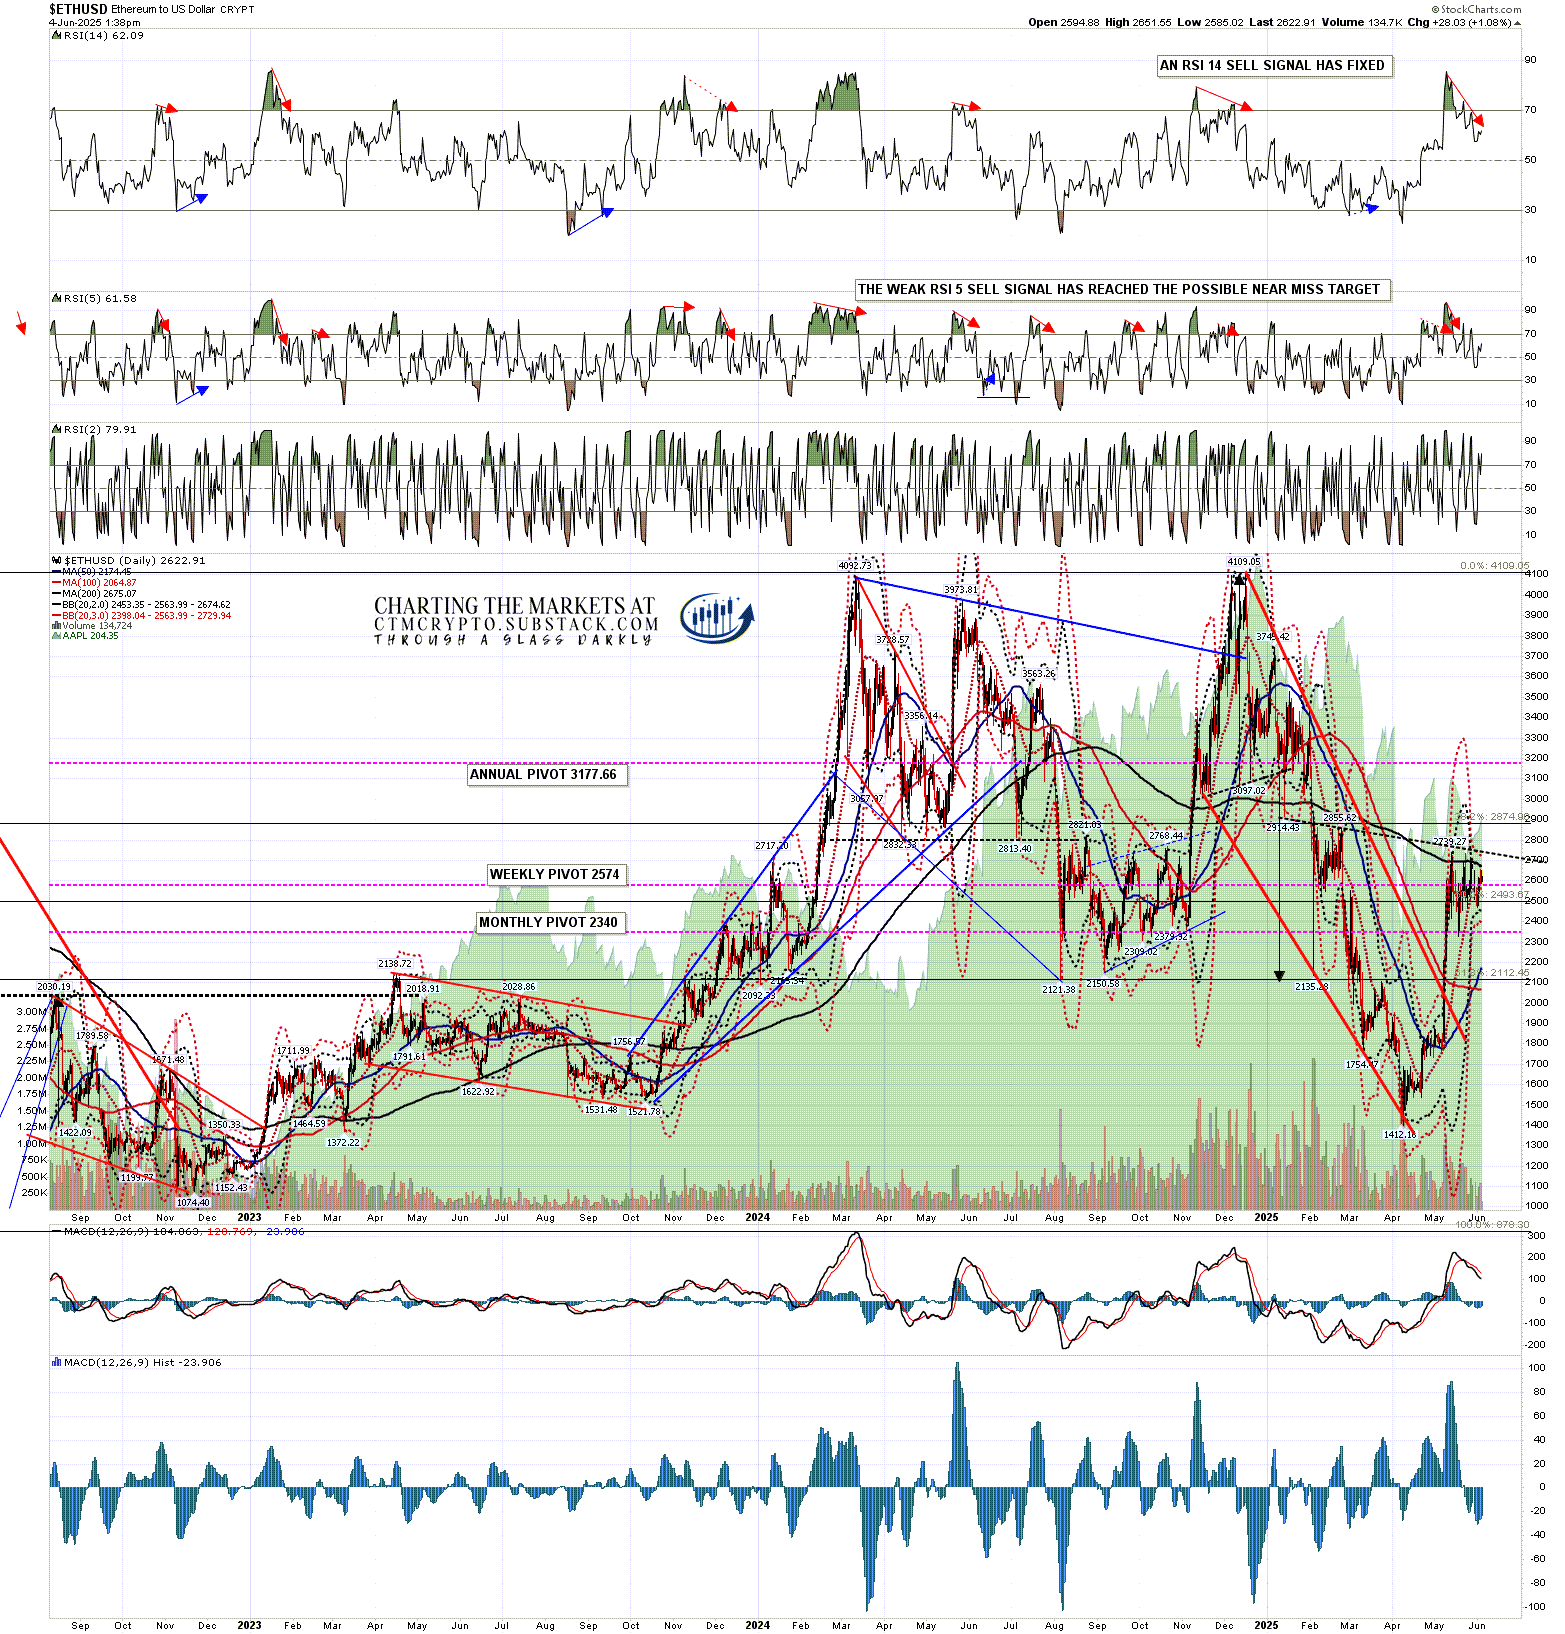
ETHUSD daily chart:- Testing the 200dma & failing there so far. A weak RSI 14 sell signal has fixed. The weak RSI 5 sell signal reached target.
ETHUSD 60min chart:- Possible large IHS forming.Possible smaller double top forming with support at 2326.50. An RSI 14 sell signal has fixed.
