


Crypto Premarket Webinar 1st July 2025 + Charts + New Monthly Pivots

Premarket video:
New monthly pivots:

MARKET NOTES - BULLS REALLY NEED TO BREAK AND CONVERT THE DAILY MIDDLE BANDS TO OPEN THE UPSIDE
BTCUSD weekly chart:- Bitcoin made a new all time high. This invalidated the double top target at 69-70k and could be the second high of a double top, though I’m not seeing much reason to think that might be the case. Weekly middle band support currently at 95544.

BTCUSD daily chart:- The daily RSI 5 sell signal has reached target. Bitcoin has converted the daily middle band, currently at 105672, to support. Likely bull flag forming with flag resistance in the 109.0k area.

BTCUSD 60min chart:- Bitcoin may be returning to retest the all time high. If a bull flag is forming, there may be a move to test possible flag support in the 100k area before that ATH retest. - TESTED. Likely bull flag forming with flag resistance in the 109.0k area.

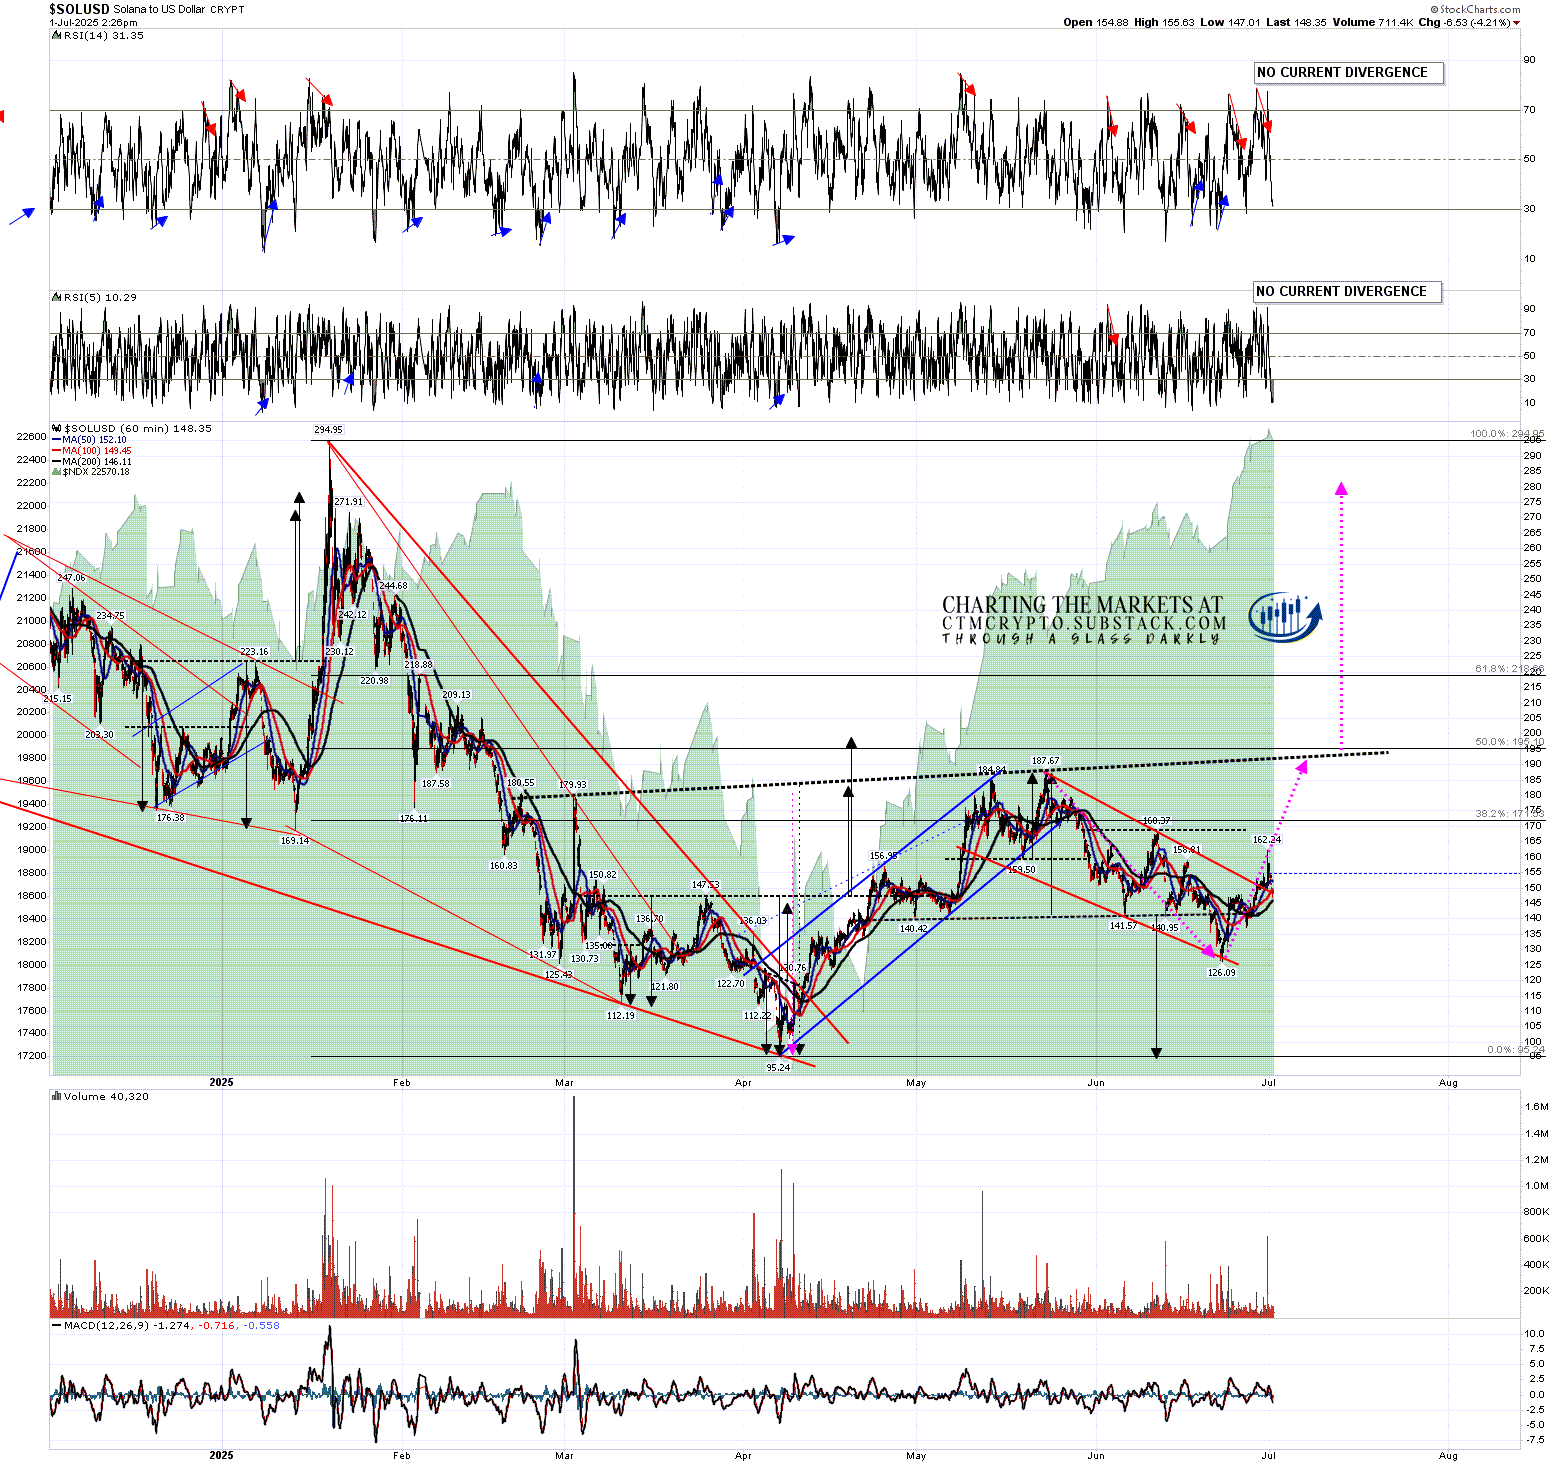
SOLUSD daily chart:- Testing & failing so far at the 200dma on the bigger picture. The daily RSI 14 sell signal has reached the possible near miss target. Converted the daily middle band, currently at 146.48, back to support. Next needs to do the same with the 50dma at 158.07. Bulls need to convert both to support.

SOLUSD 60min chart:- High quality rising wedge formed which could be a bear flag & has broken down, retested the high in the second high of a double top, and broke down with a target in the 131-4 area. Possible larger IHS forming. A short term H&S has now formed and a sustained break below 140 would look for a retest of the 2025 low at 95.24. - FAILS ON A BREAK BACK OVER 168.37. Possible larger IHS right shoulder low reached. The RSI 14 sell signal reached target.
ETHUSD daily chart:- Testing the 200dma & failing there so far. Bulls need to convert the daily middle band, currently at 2466, to support. Ethereum tested the 3sd lower band at the last low and is now testing triple resistance at the daily middle band and the 200dma at 2530 and the 50dma at 2543. A break and conversion of these three levels to support opens the upside.
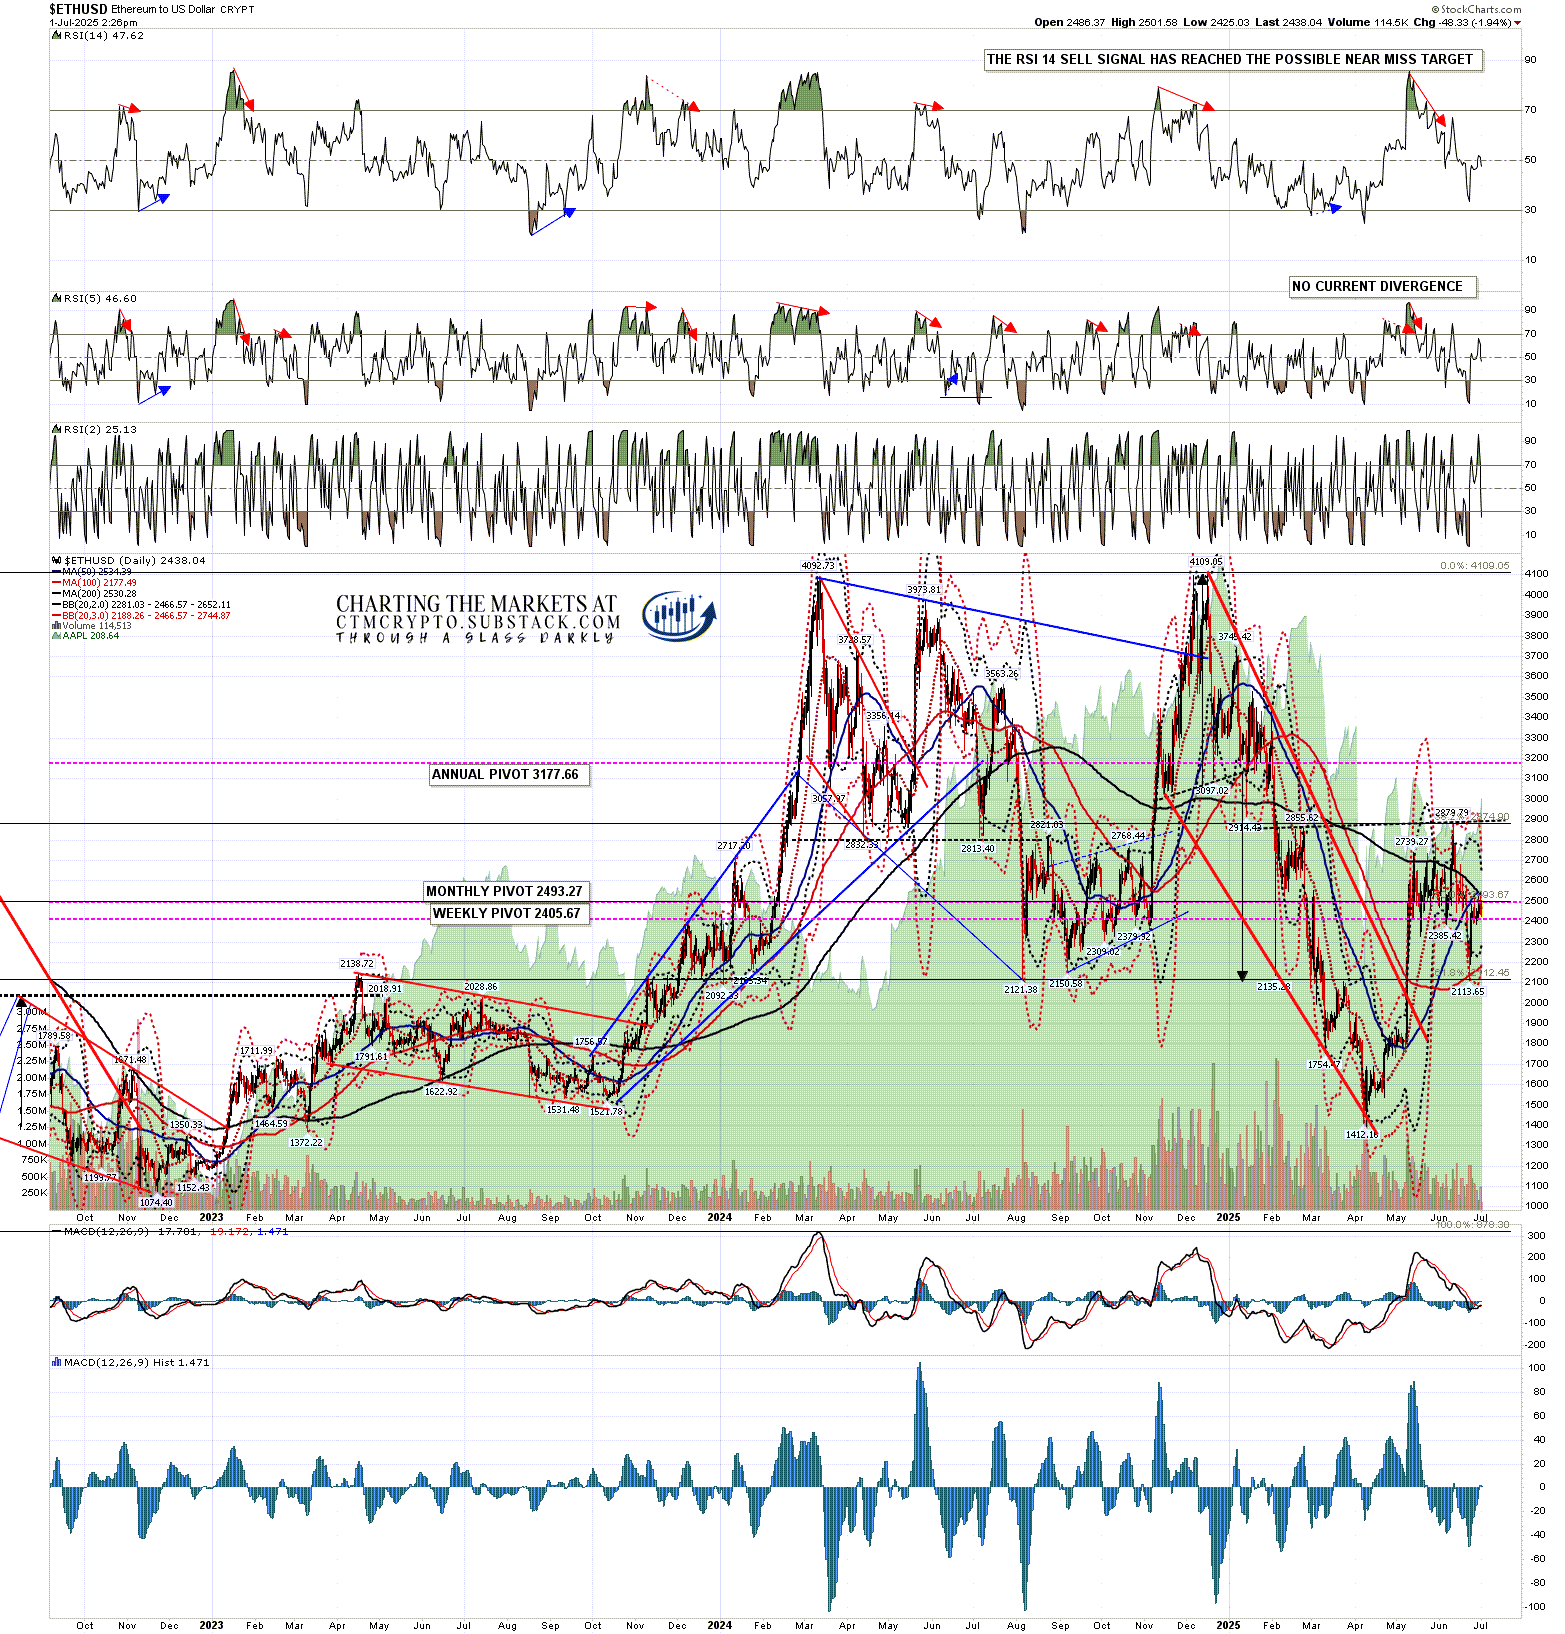
ETHUSD 60min chart:- Possible large IHS forming with a target at the December high at 4109.05. The ideal right shoulder low area has been reached.
