


Crypto Premarket Webinar 29th May 2025 + Charts

Premarket video:
Here’s the link for tomorrow’s premarket video if you want to see it live at 9.05am Eastern:
https://meet.goto.com/823017877
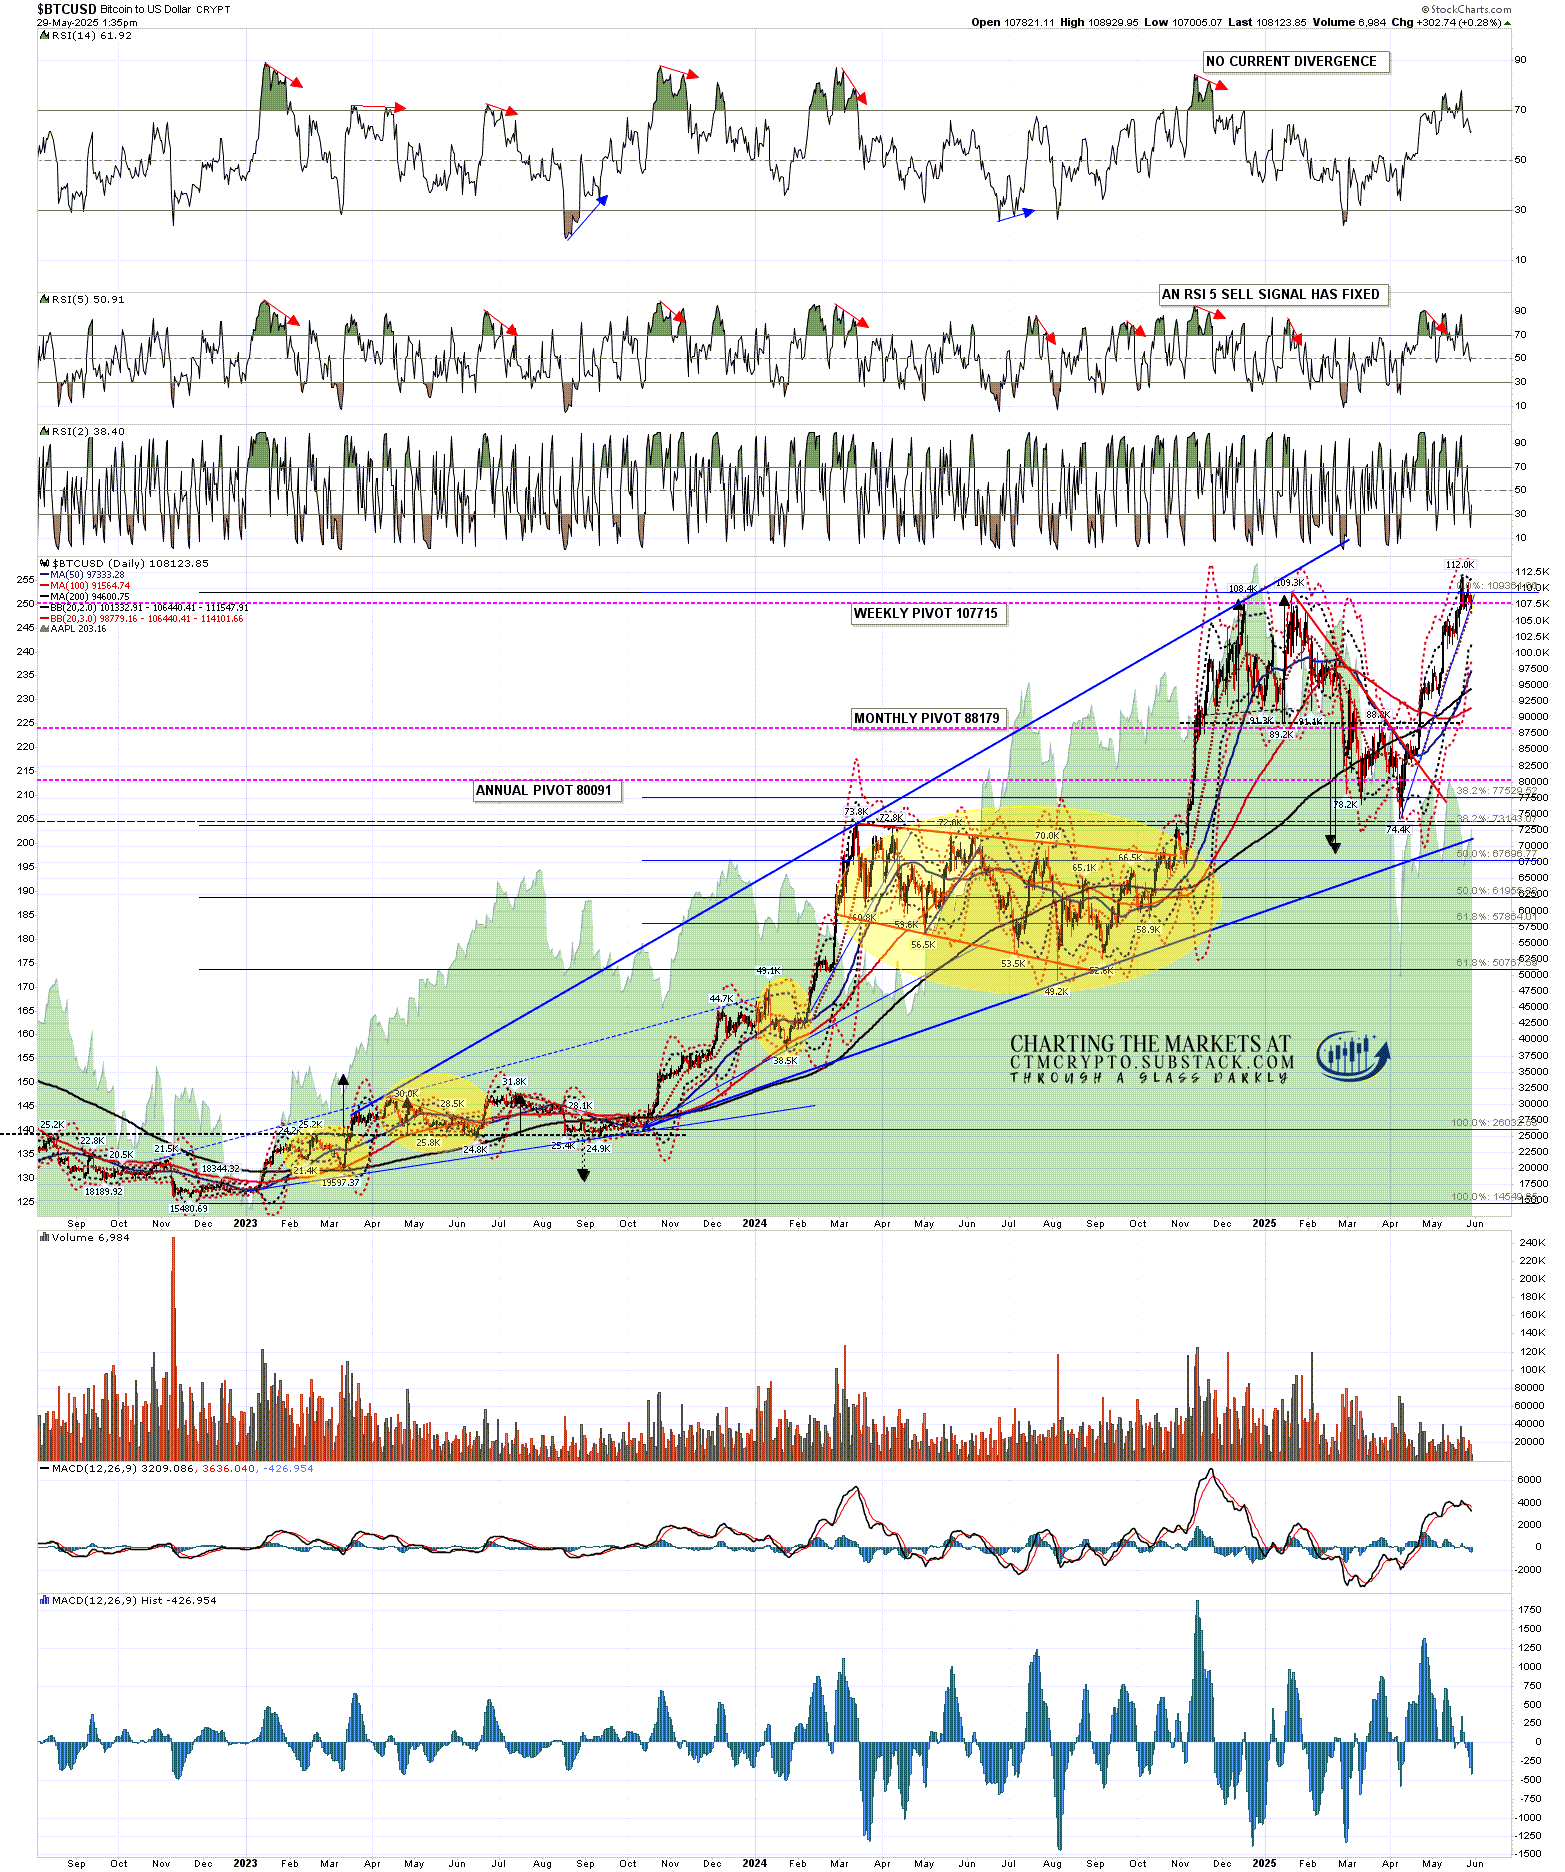
BTCUSD weekly chart:- Bitcoin has made a new all time high. This invalidates the double top target at 69-70k and could be the second high of a double top, though I’m not seeing much reason to think that might be the case.

BTCUSD daily chart:- daily RSI 5 sell signal fixed. The daily RSI 14 sell signal divergence was lost.
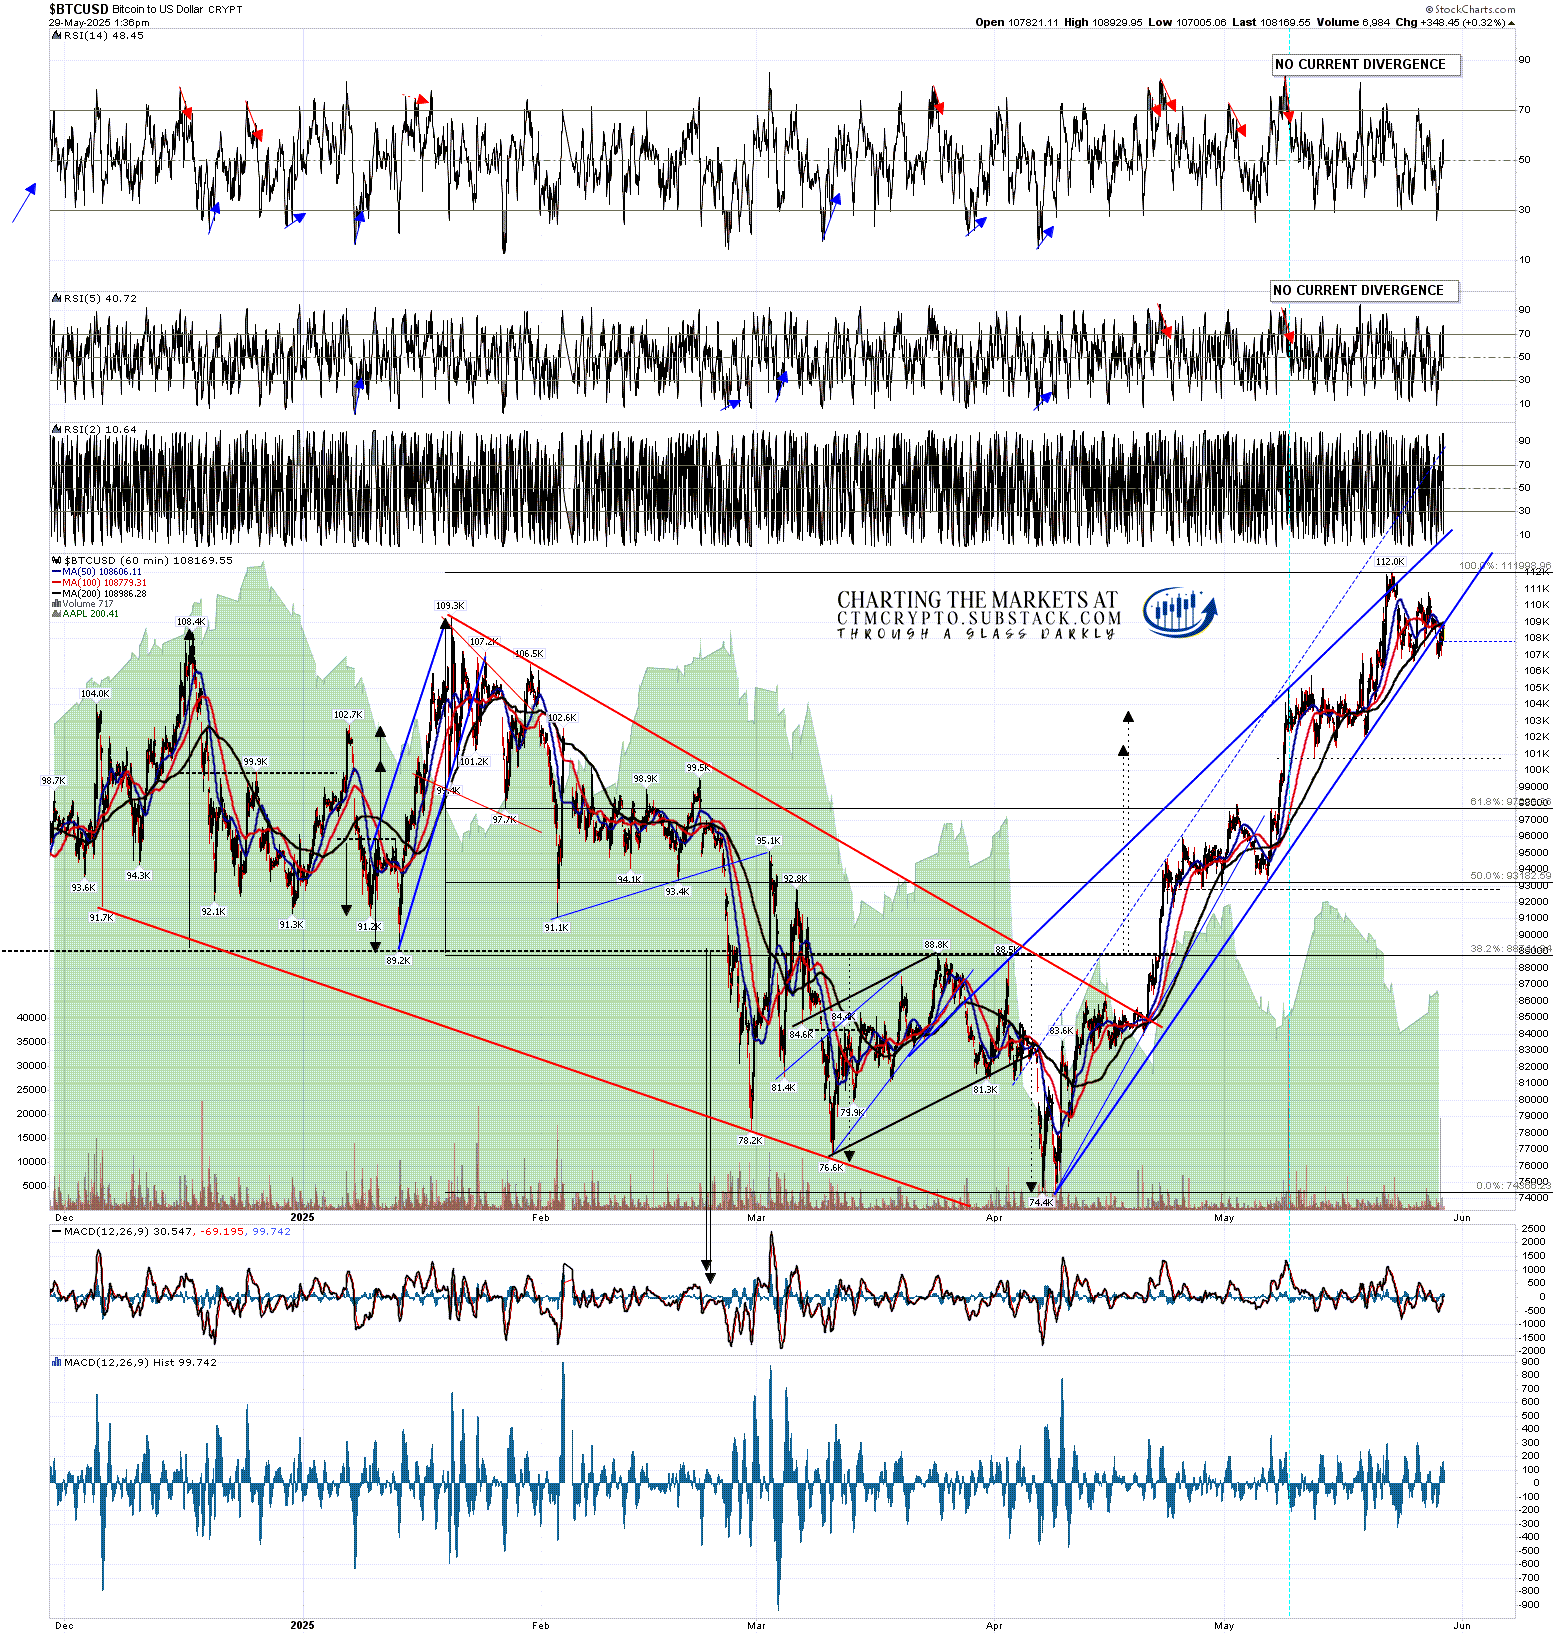
BTCUSD 60min chart:- Bitcoin reached the high quality wedge resistance and has broken over it slightly. This may be a bearish overthrow. If this wedge was to break up rather than down the wedge target would be in the 146k area.
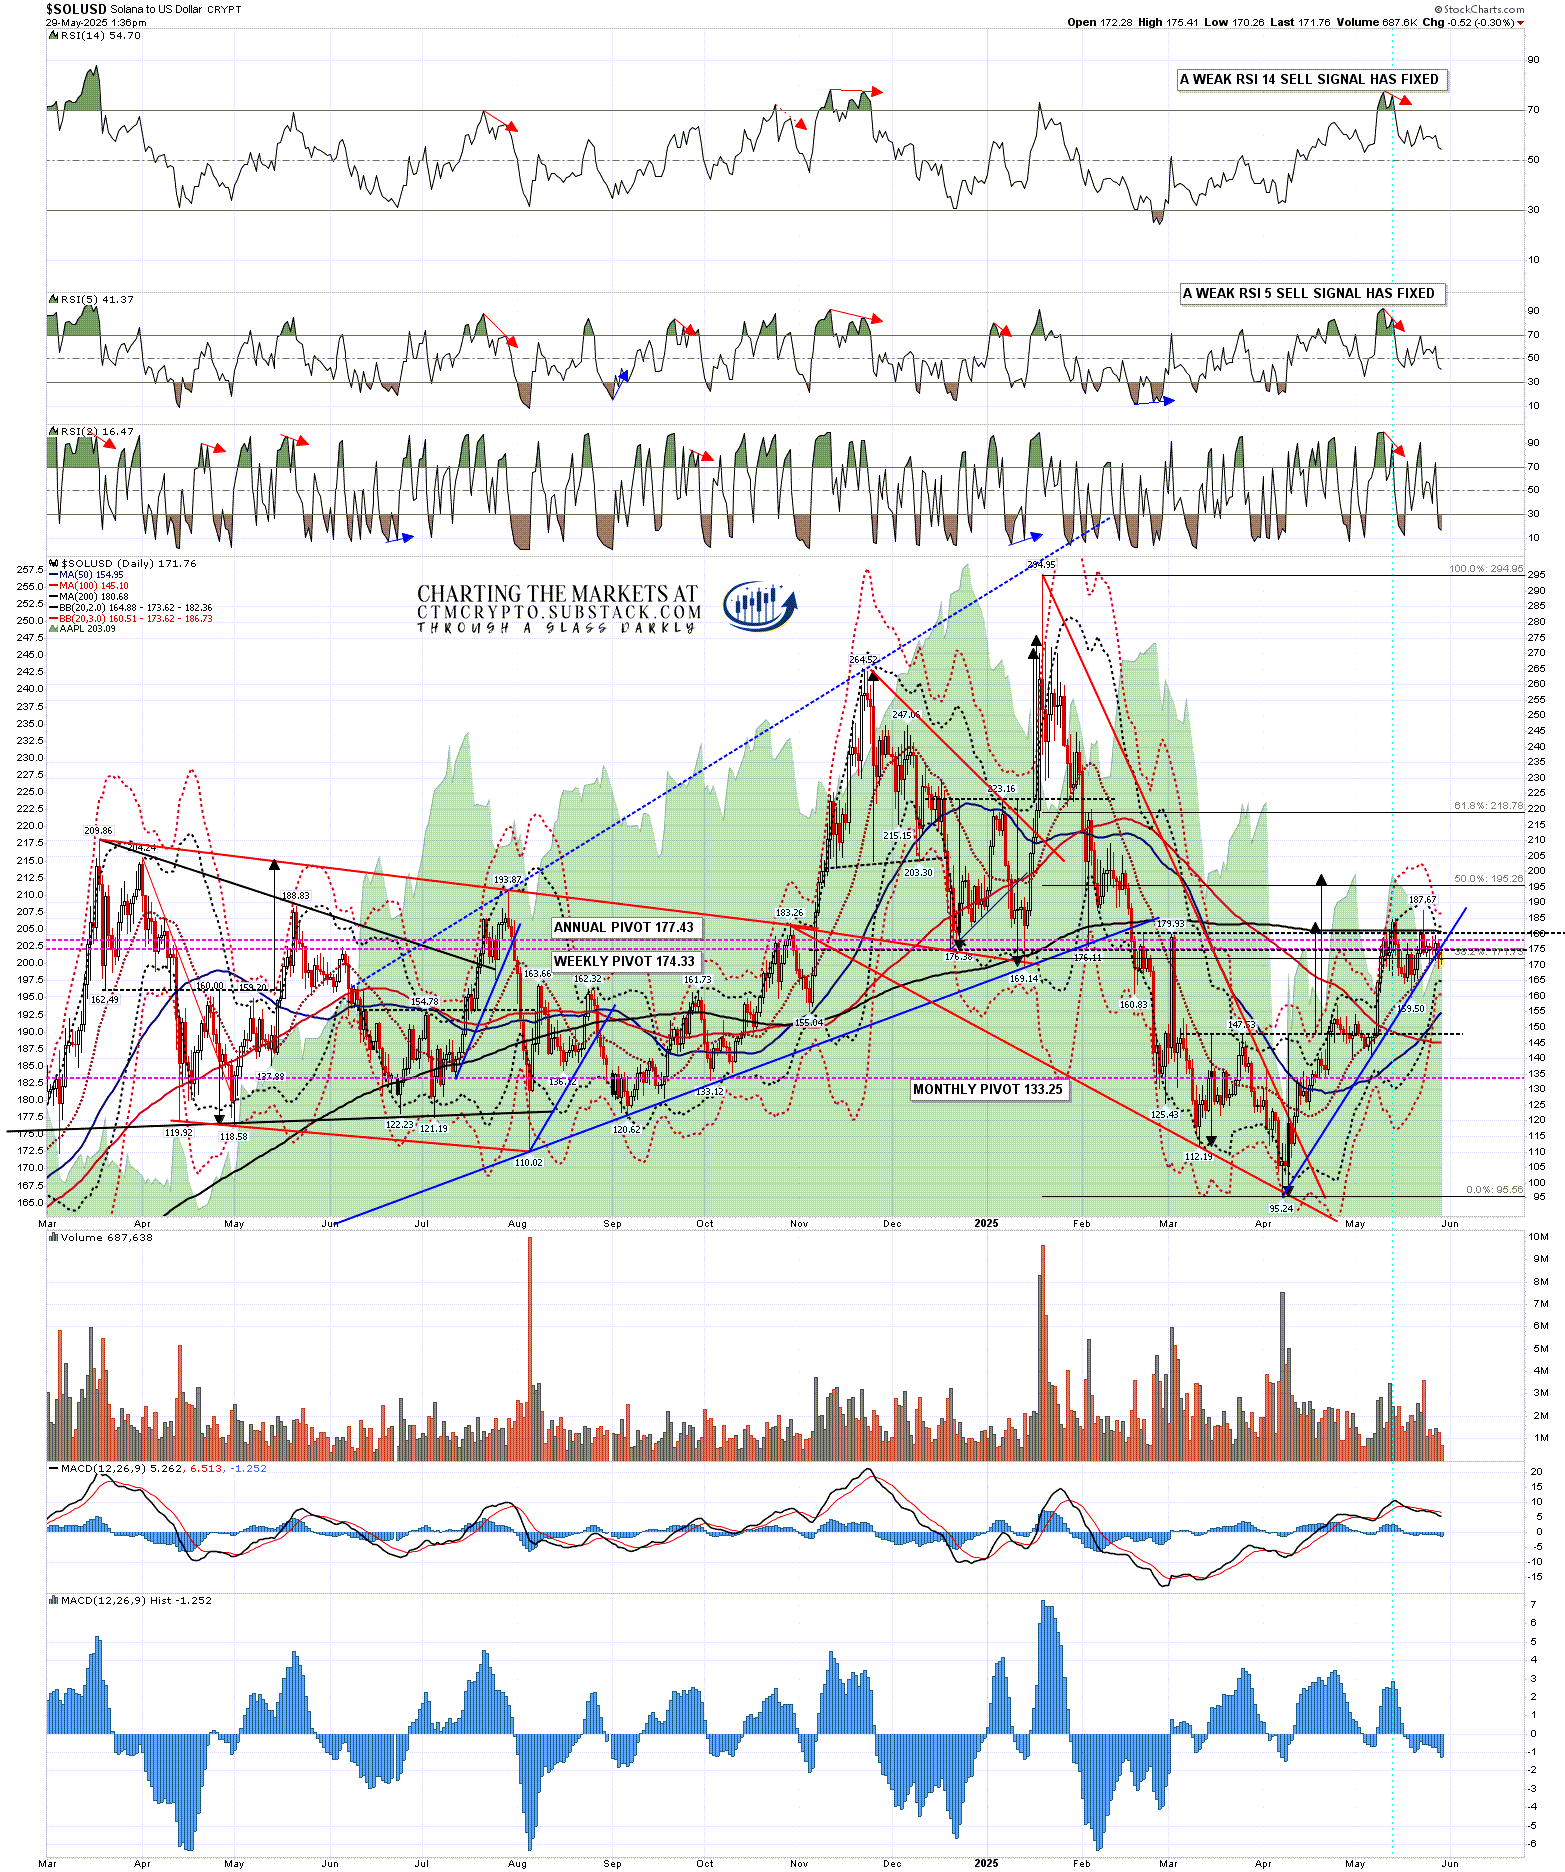
SOLUSD daily chart:- Weak RSI 14 & RSI 5 sell signals fixed. Testing & failing so far at the 200dma.
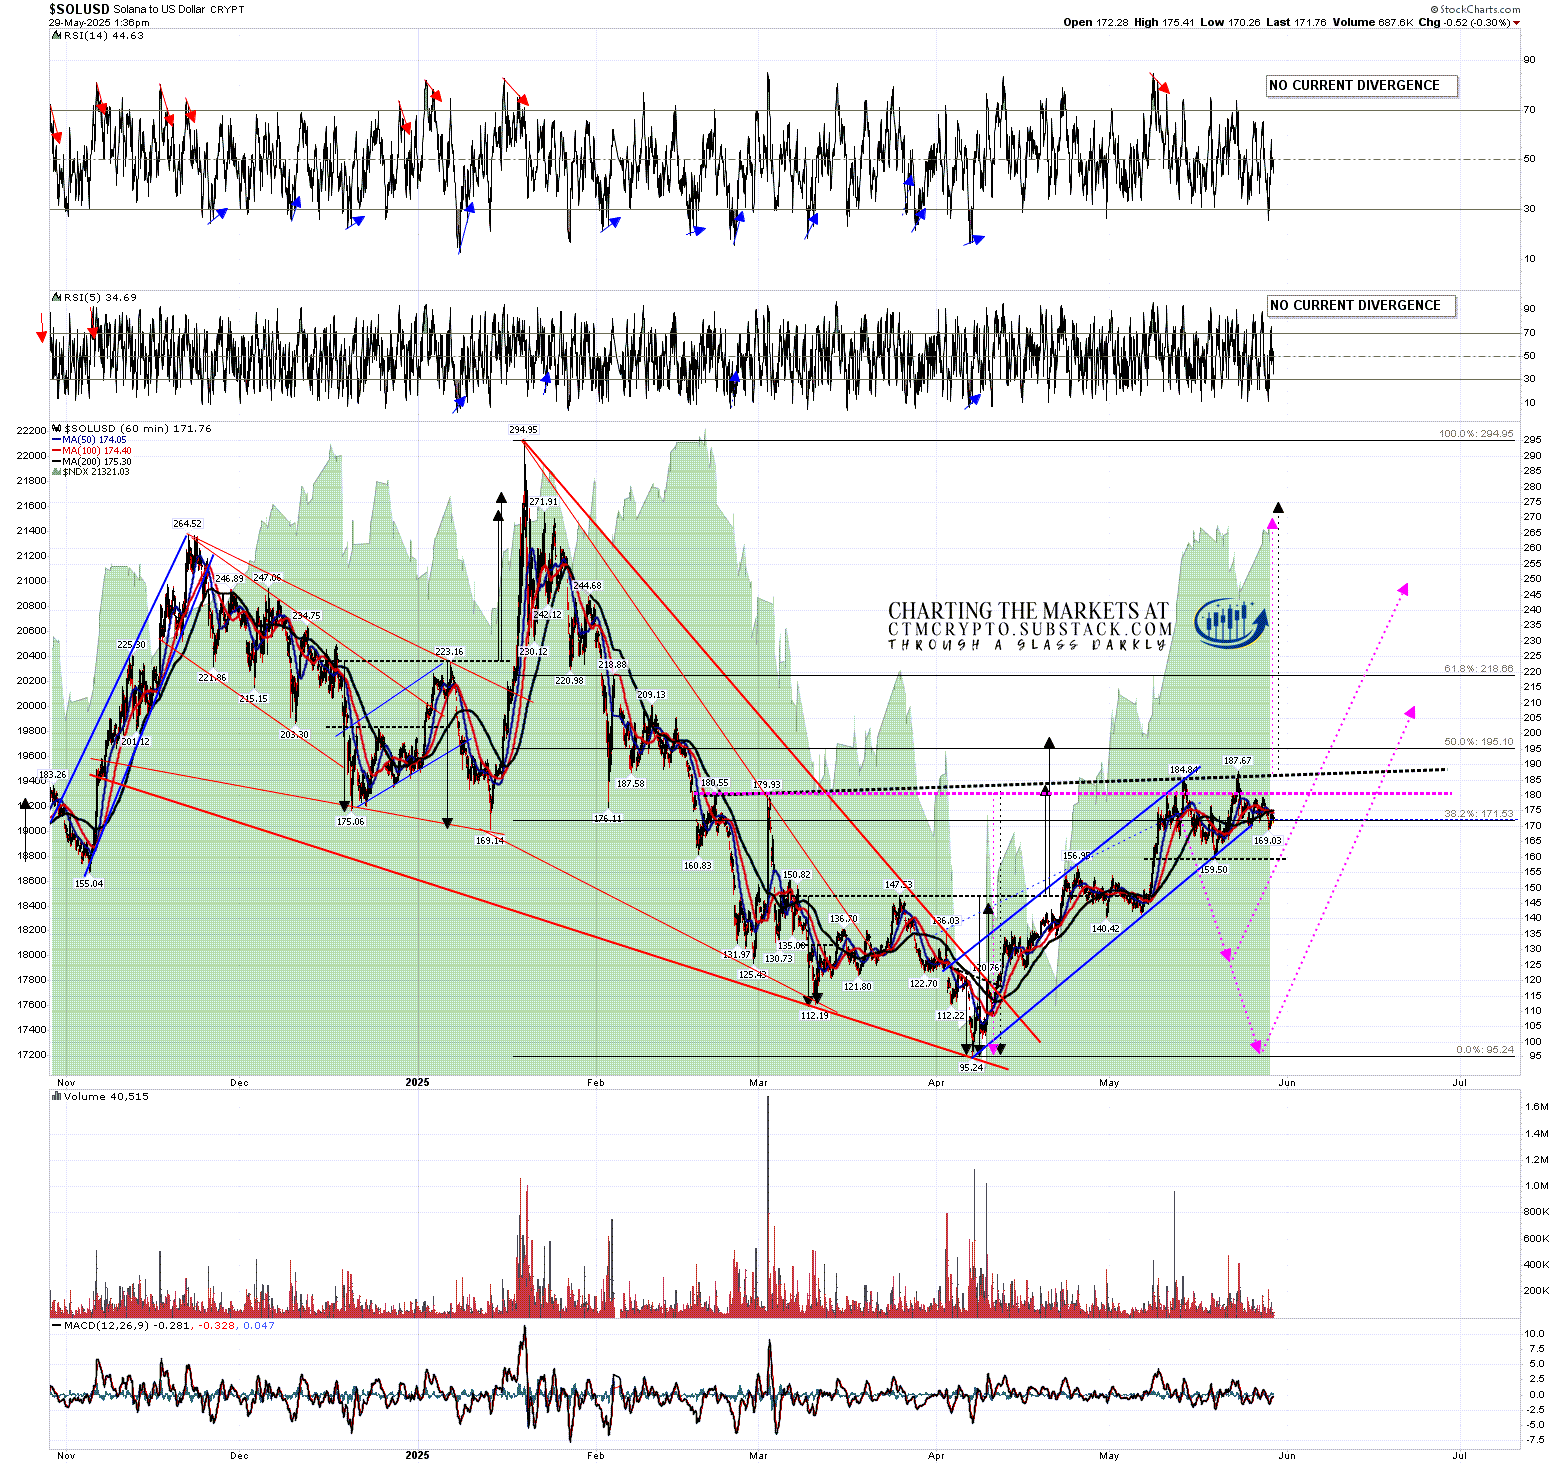
SOLUSD 60min chart:- High quality rising wedge formed which could be a bear flag & now breaking down slightly. Possible larger IHS forming. If so ideal right shoulder low in the 125 area but need not be that low. A small H&S broken down with a target in the 143 area and failed. Possible small double top setup formed & on a sustained break below 159.5 the target area would be 141 to 144 area.
ETHUSD daily chart:- Weak RSI 14 & RSI 5 sell signals fixed. Testing the 200dma currently at 2695.48.

ETHUSD 60min chart:- Possible large IHS forming. Ideal right shoulder low in the 2135 area but need not be that low. Currently this looks like a bull flag forming that could retest highs directly but might deliver another leg down first with a low below 2326.50. Possible small double top setup formed & on a sustained break below 2326.50 the target area would be 1910 to 1960 area.
