Crypto Premarket Webinar 21st May 2025 + Charts

Premarket video:
Here’s the link for tomorrow’s premarket video if you want to see it live at 9.05am Eastern:
https://meet.goto.com/823017877
The biggest level to break to clear the path for this retracement is rising support on Bitcoin, shown on the hourly chart and currently in the 102.9k area.
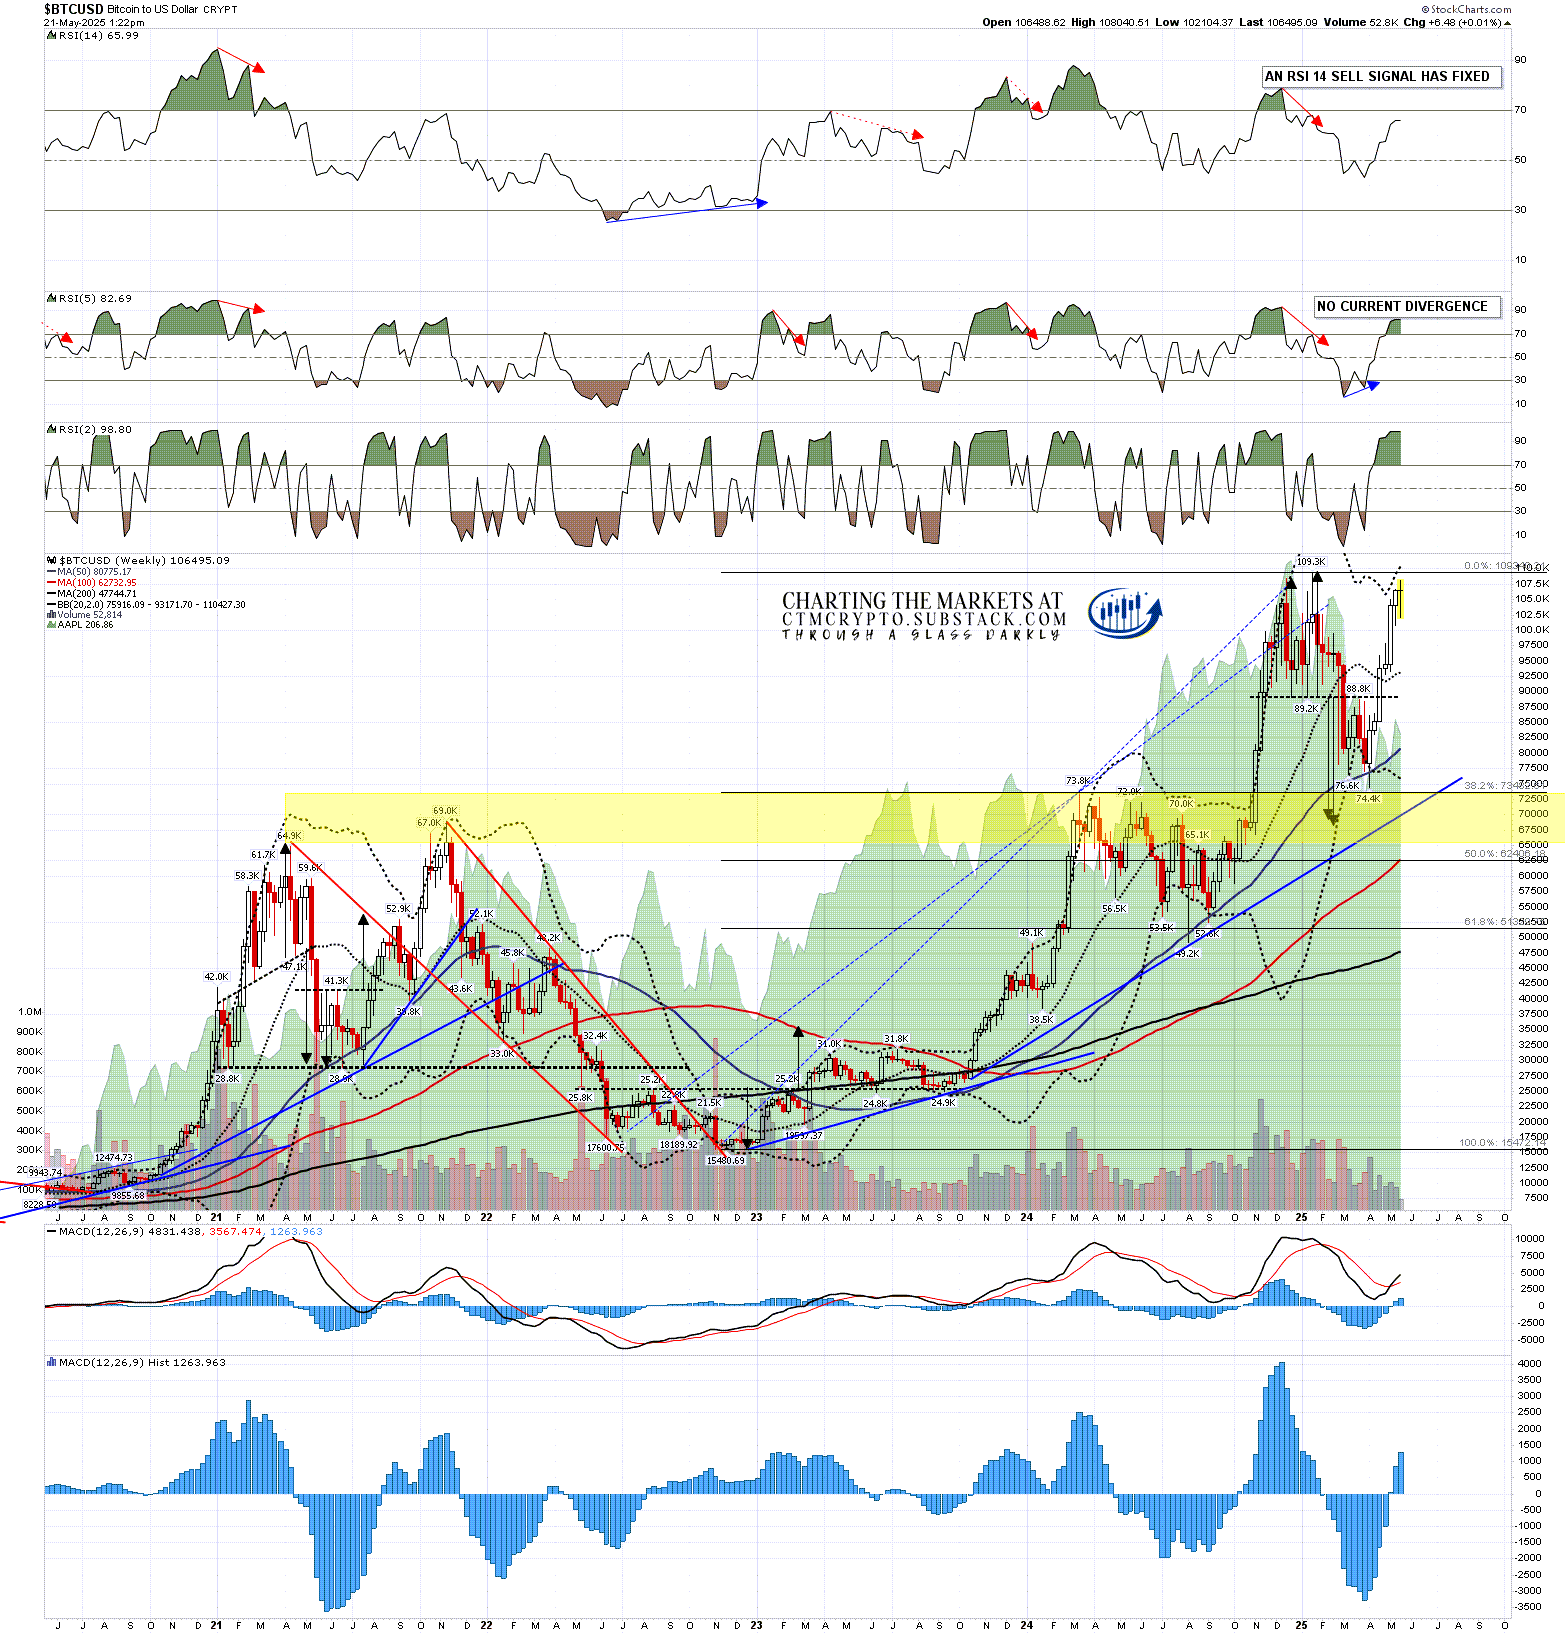
BTCUSD weekly chart:- Close to ATH retest but wondering about a leg down within an overall bull flag or triangle forming.
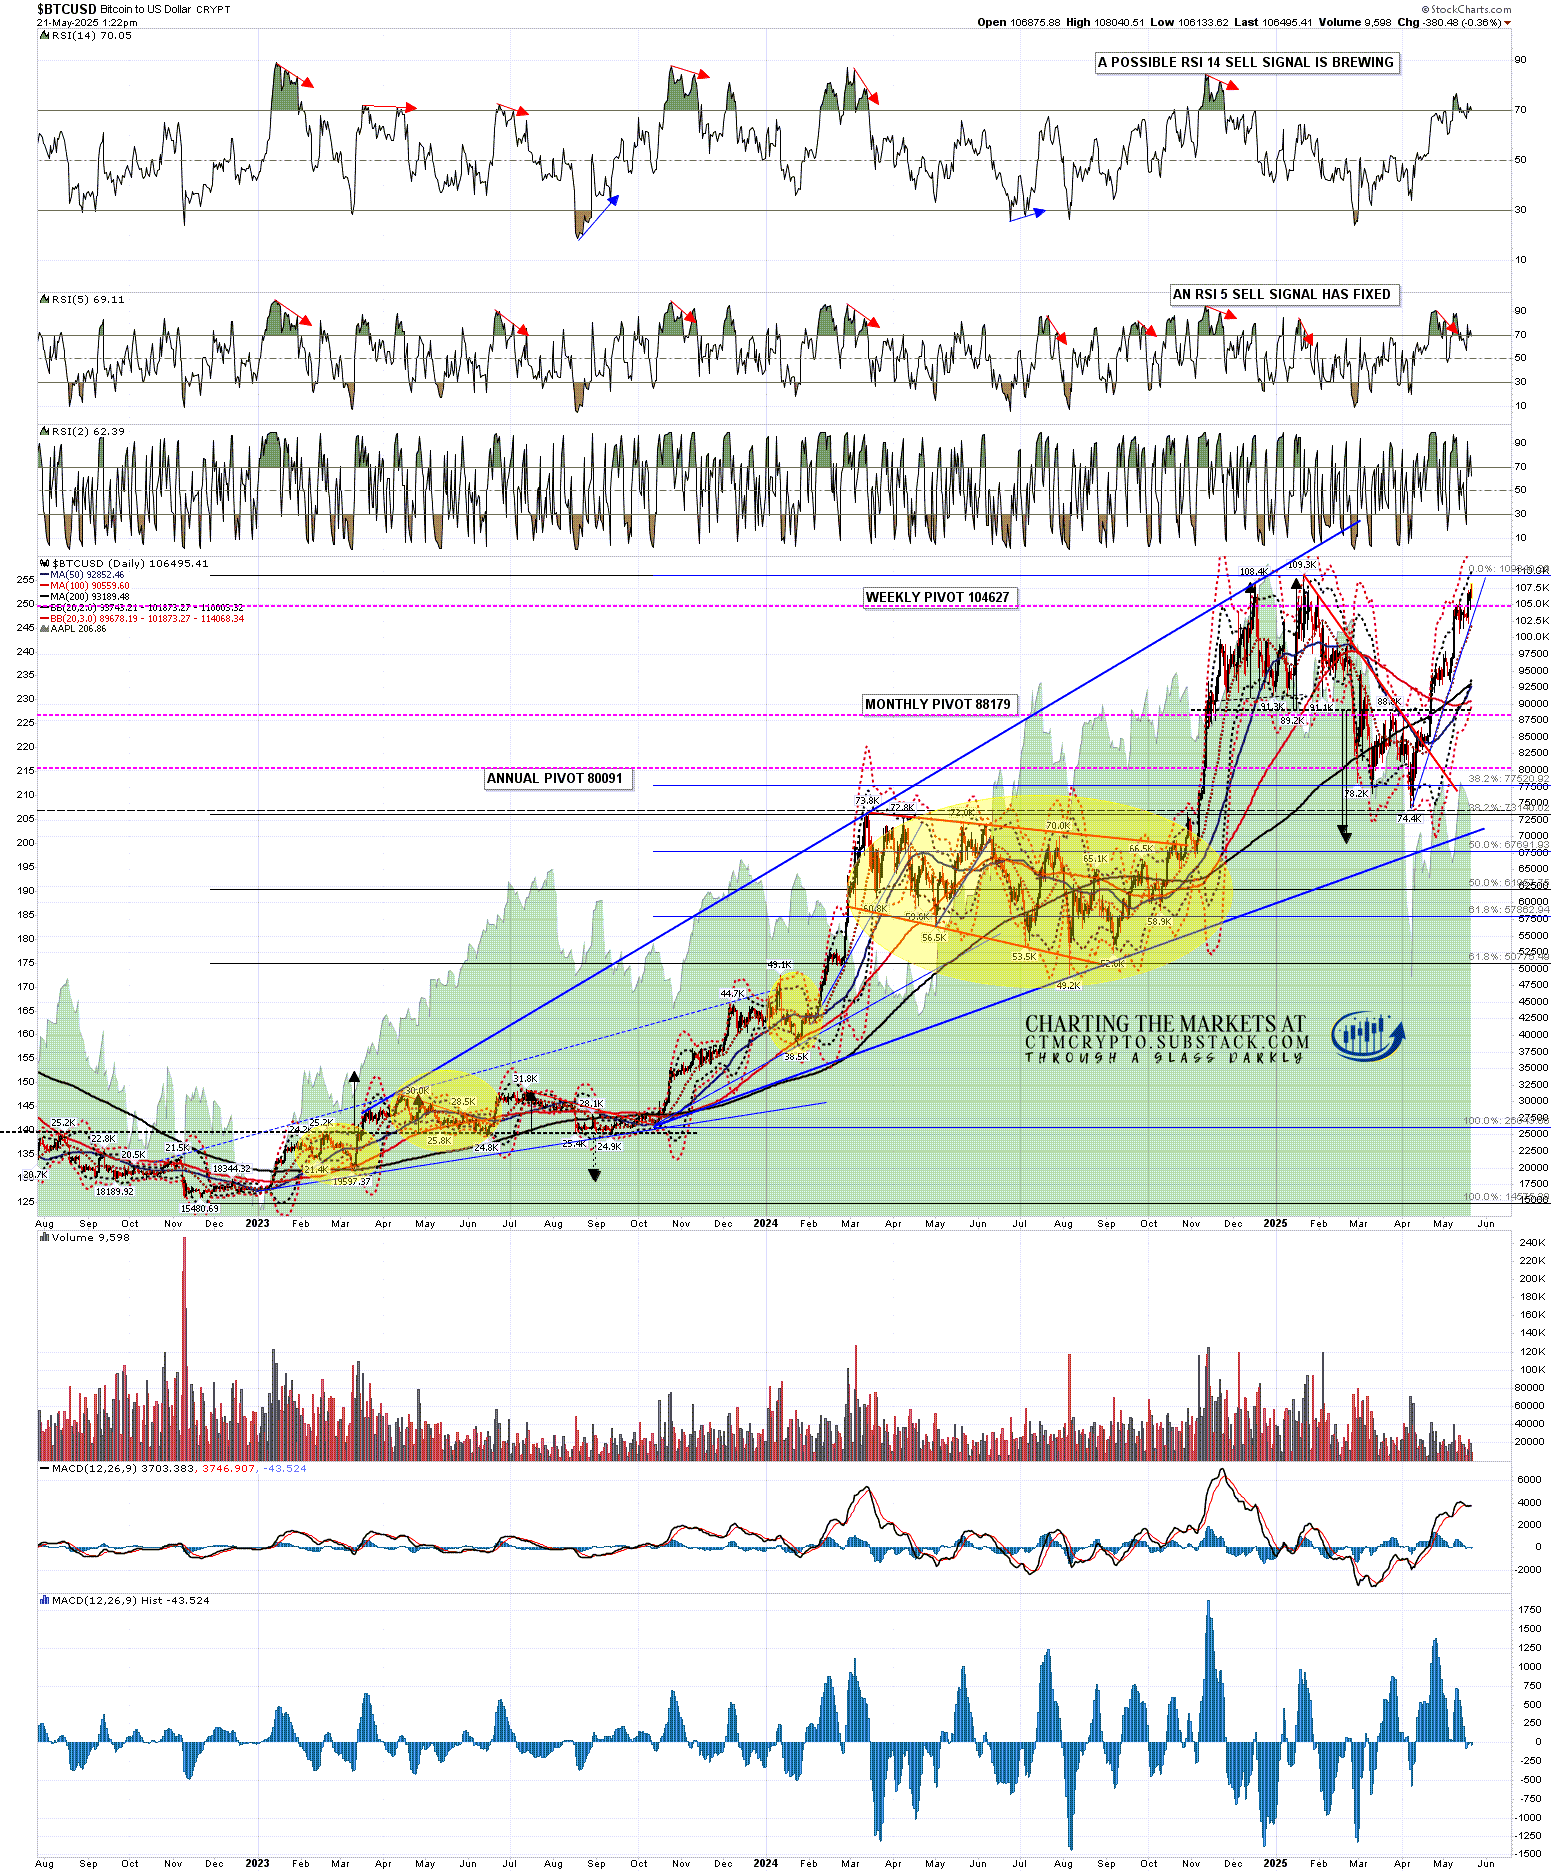
BTCUSD daily chart:- Possible RSI 14 sell signal brewing & RSI 5 sell signal fixed. Open bigger picture double top target at 69-70k.
BTCUSD 60min chart:- High quality rising wedge formed which could be a bear flag & testing wedge support. A sustained break below double top support at 102k would look for a target in the 96-7k area.

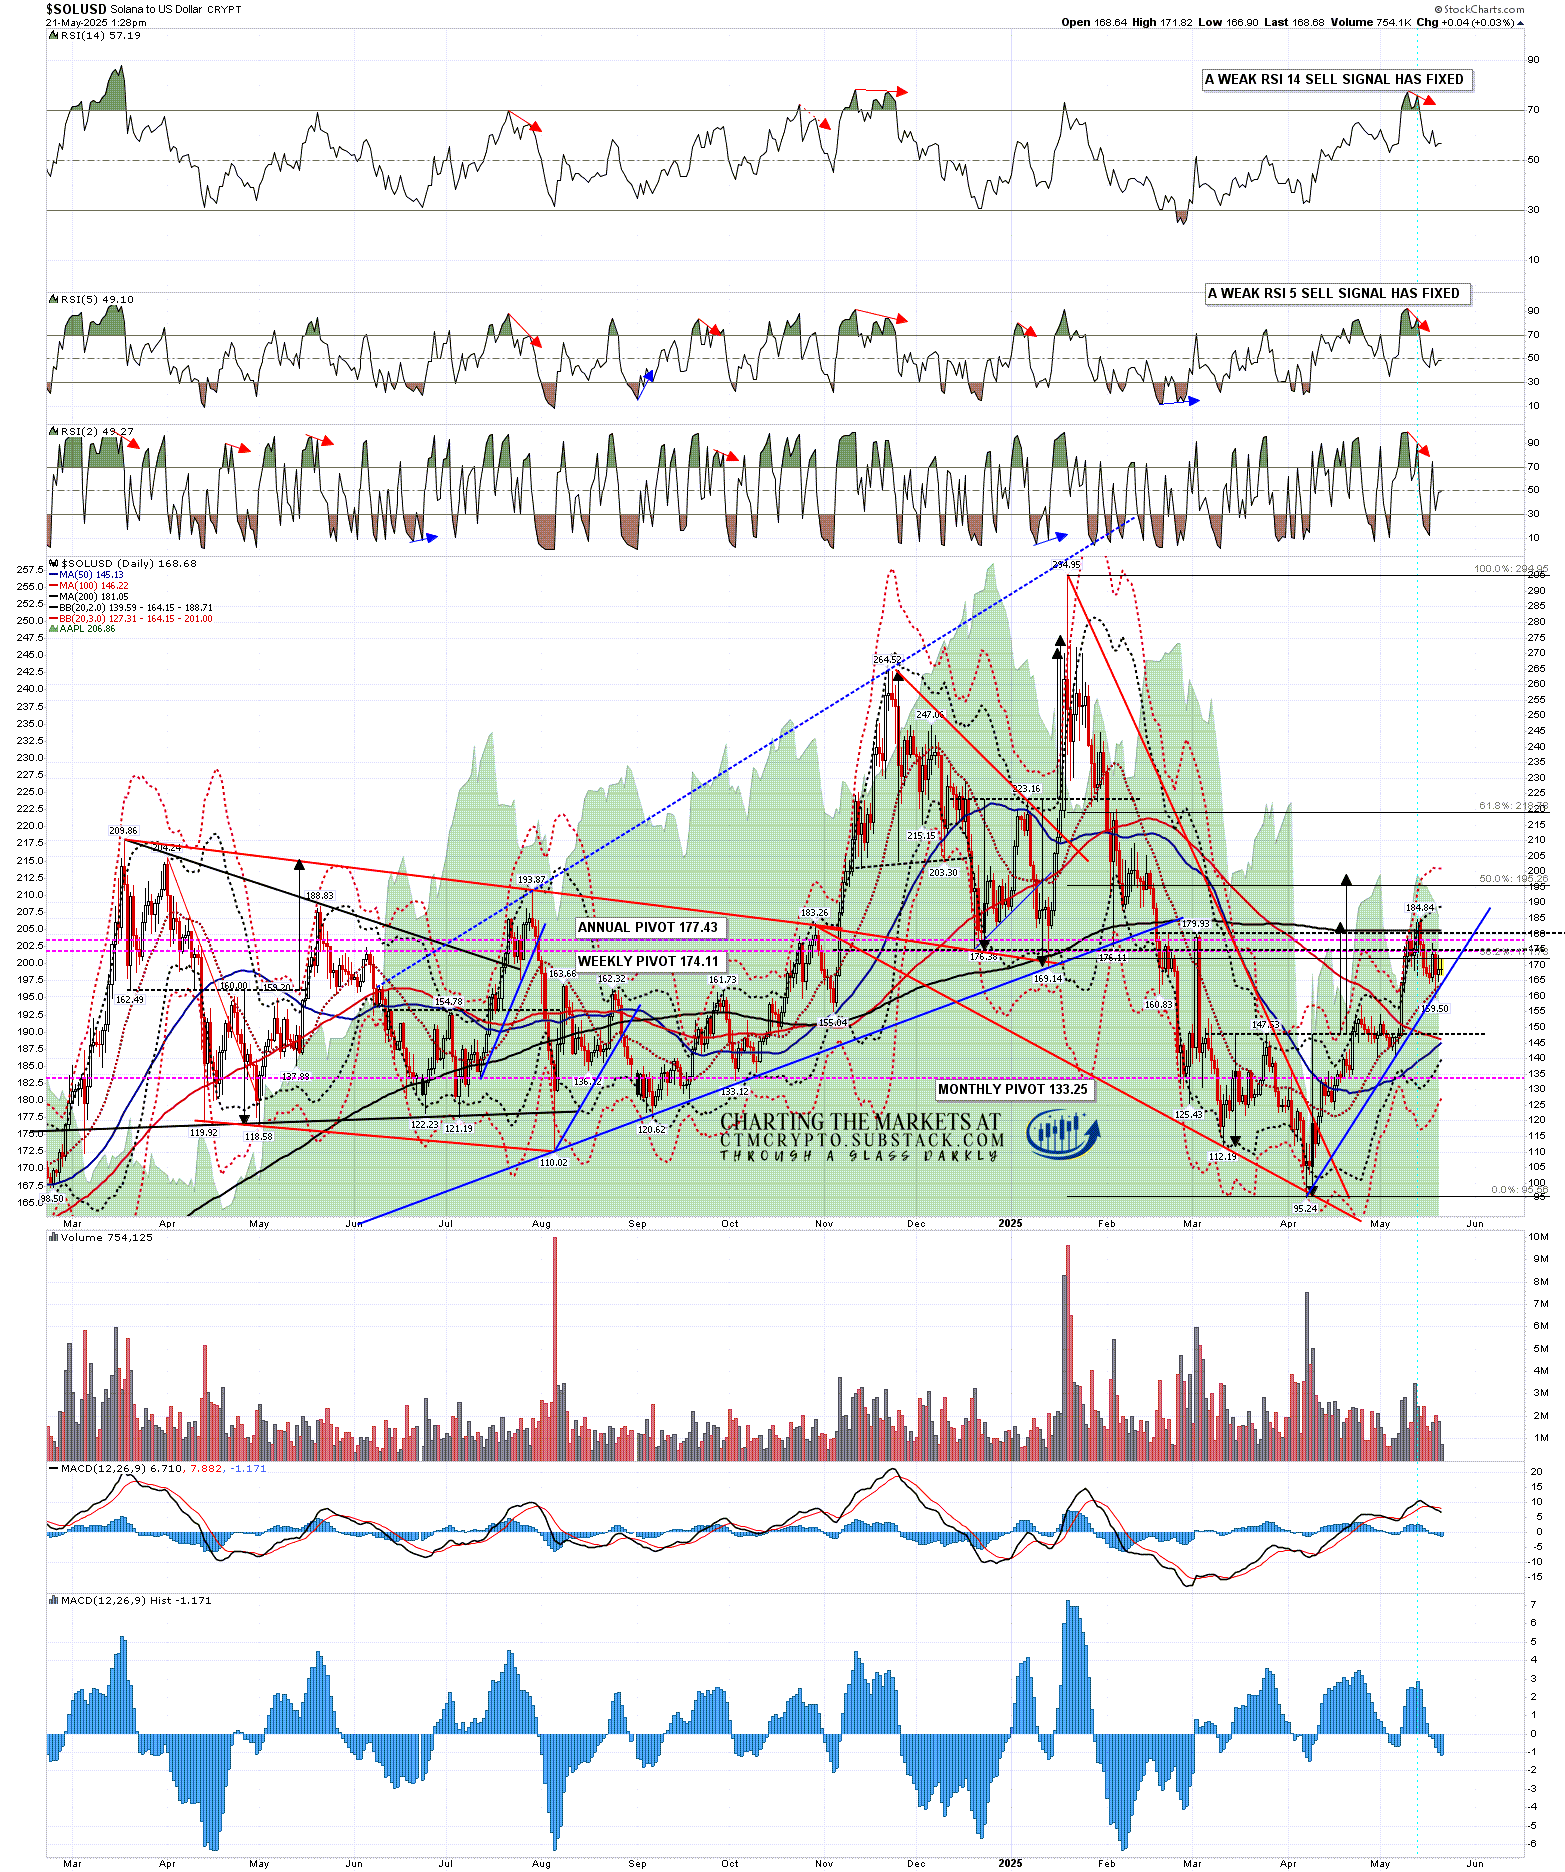
SOLUSD daily chart:- Weak RSI 14 & RSI 5 sell signals fixed.
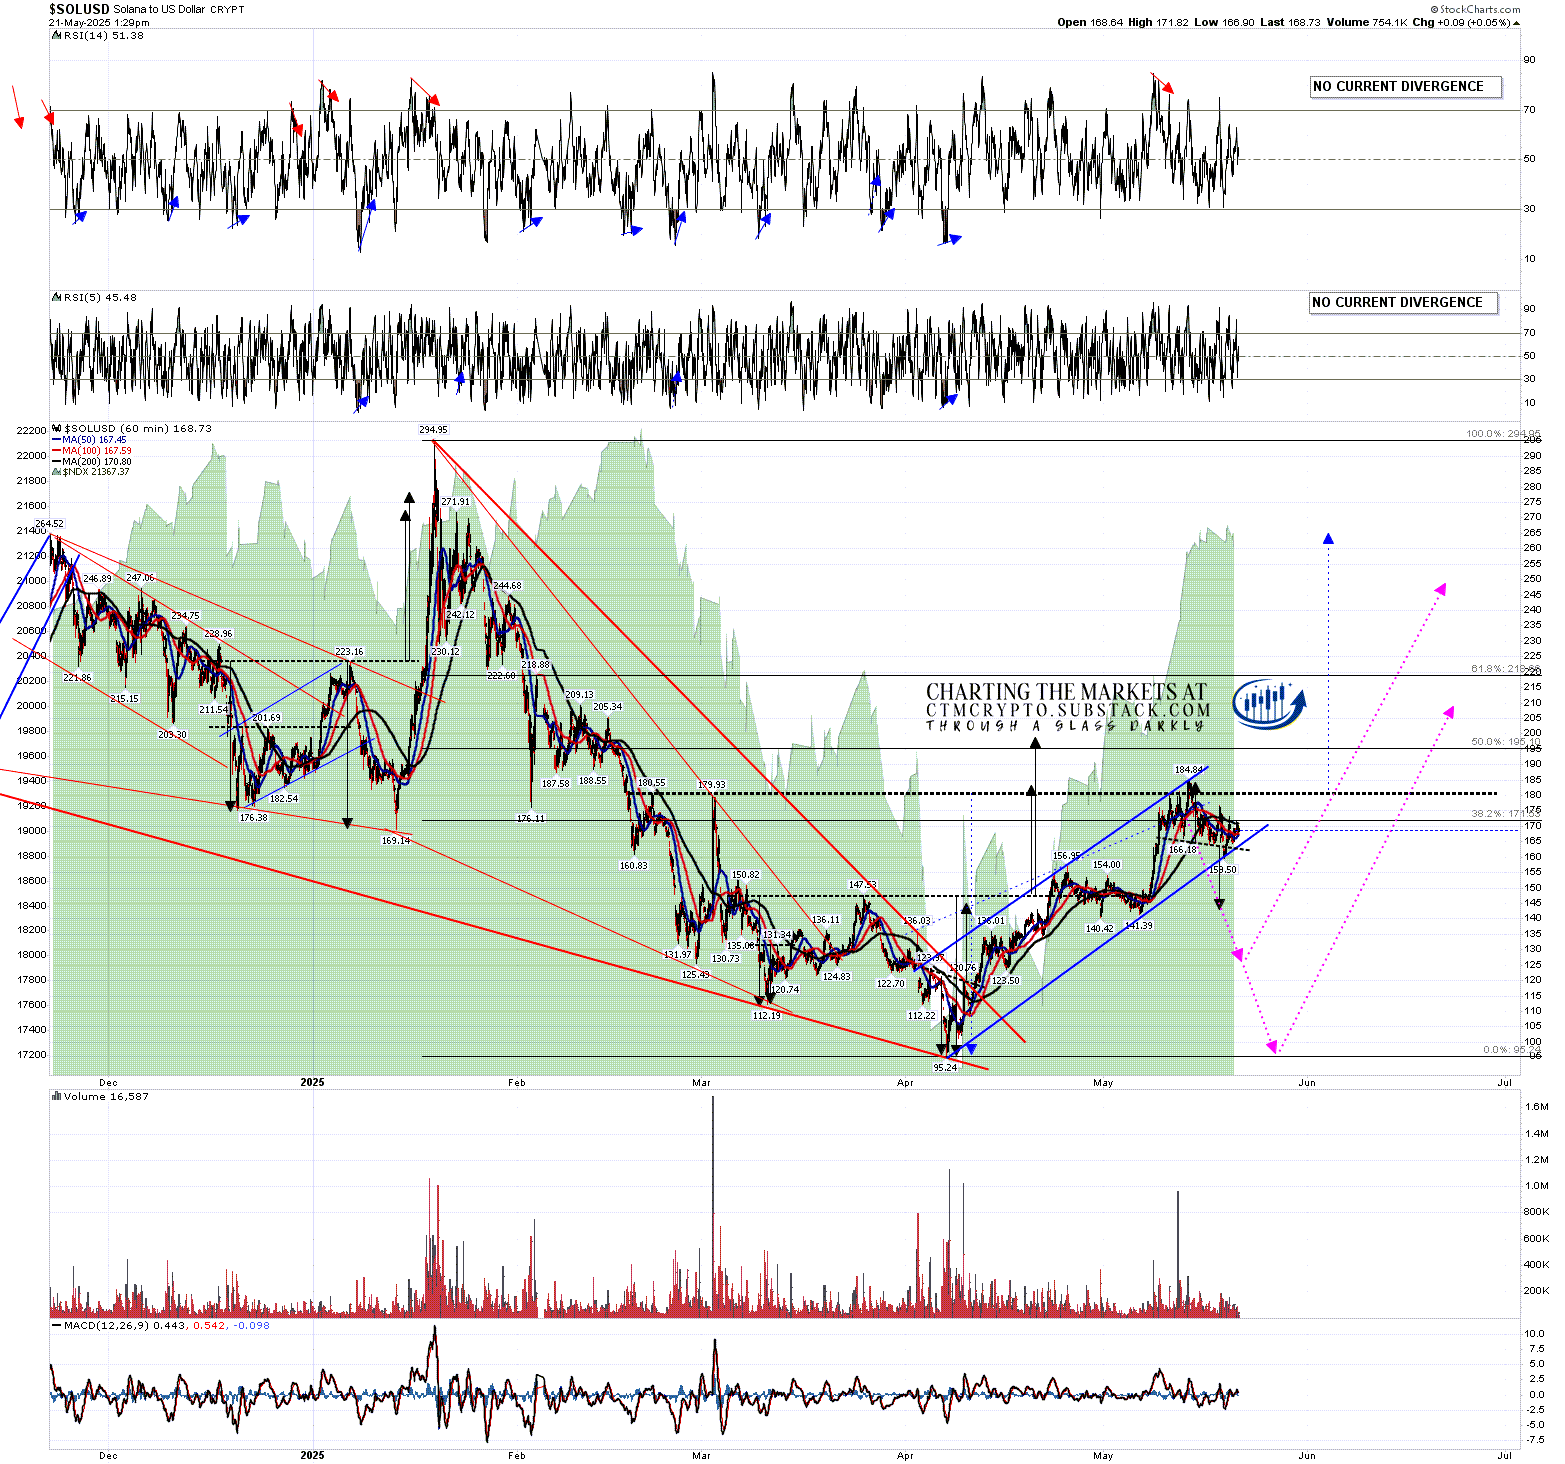
SOLUSD 60min chart:- High quality rising wedge formed which could be a bear flag & now breaking down slightly. A small H&S has broken down with a target in the 143 area. Possible larger IHS forming. If so ideal right shoulder low in the 125 area.
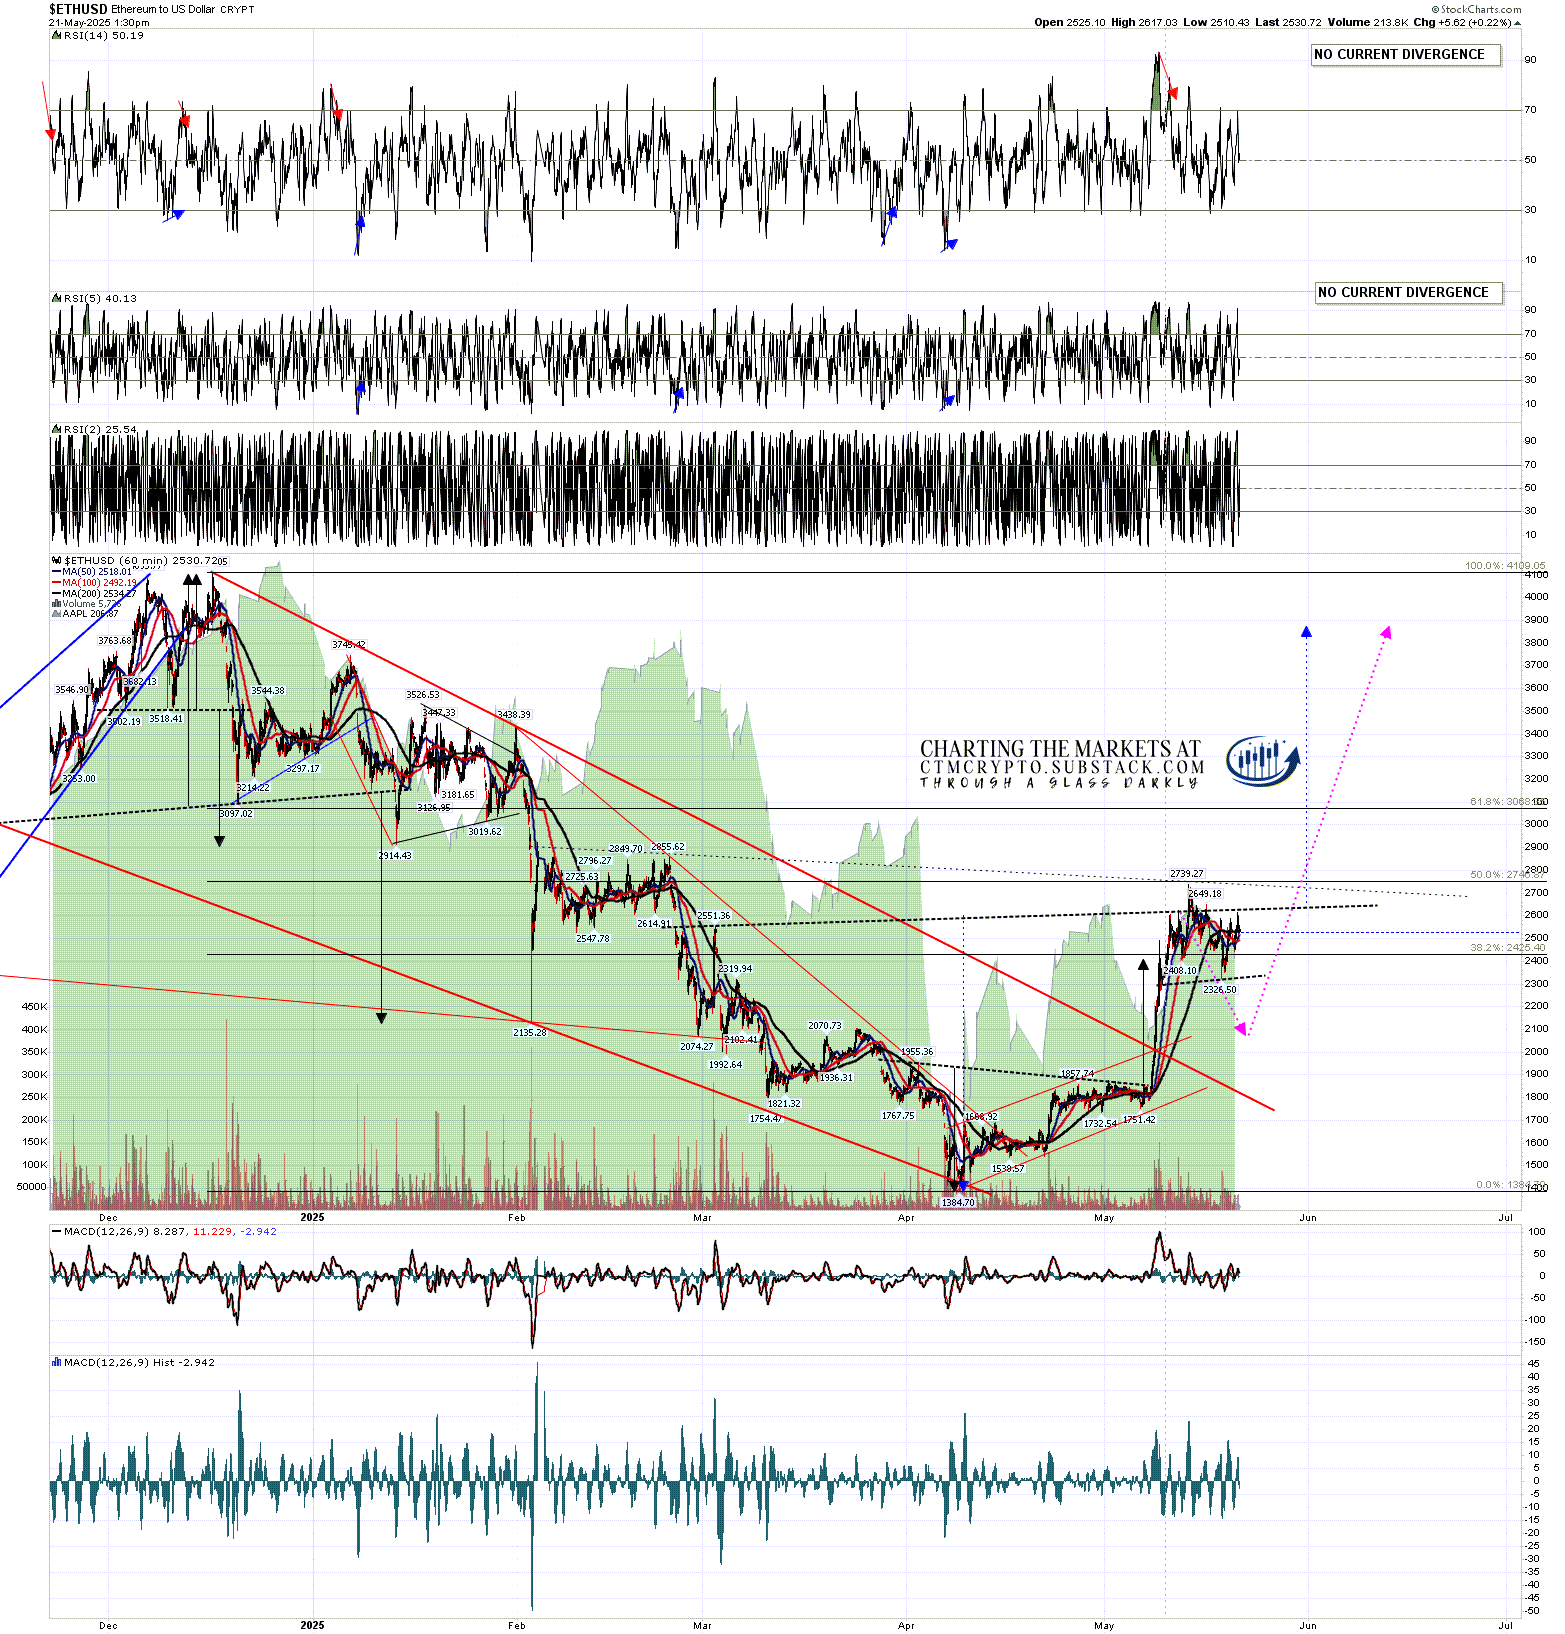
ETHUSD daily chart:- Weak RSI 14 & RSI 5 sell signals fixed.

ETHUSD 60min chart:- Possible large IHS forming. Ideal right shoulder low in the 2135 area. Possible smaller H&S forming to set up that right shoulder retracement.